As filed with the U.S. Securities and Exchange Commission on October 14, 2021.
Registration No. 333-259740
Delaware | | | 1389 | | | 87-1022110 |
(State or other jurisdiction of incorporation or organization) | | | (Primary Standard Industrial Classification Code Number) | | | (I.R.S. Employer Identification Number) |
Hillary H. Holmes Andrew L. Fabens Gibson, Dunn & Crutcher LLP 811 Main Street, Suite 3000 Houston, Texas 77002 (346) 718-6600 | | | David J. Miller Trevor Lavelle Latham & Watkins LLP 301 Congress Avenue, Suite 900 Austin, Texas 78701 (737) 910-7300 |
Large accelerated filer | | | ☐ | | | Accelerated filer | | | ☐ |
Non-accelerated filer | | | ☒ | | | Smaller reporting company | | | ☐ |
| | | | | Emerging growth company | | | ☒ |
Title of Each Class of Securities to be Registered | | | Amount to be Registered(1) | | | Proposed Maximum Offering Price Per Share(2) | | | Proposed Maximum Aggregate Offering Price(1)(2) | | | Amount of Registration Fee(3) |
Class A common stock, par value $0.01 per share | | | 20,297,500 | | | $18.00 | | | $365,355,000 | | | $33,868 |
| | | Per Share | | | Total | |
Initial public offering price | | | $ | | | $ |
Underwriting discounts and commissions(1) | | | $ | | | $ |
Proceeds, before expenses, to us | | | $ | | | $ |
(1) | See “Underwriting” for a description of all underwriting compensation payable in connection with this offering. |
Goldman Sachs & Co. LLC | | | Citigroup |
J.P. Morgan | | | Wells Fargo Securities |
Barclays | | | Evercore ISI |
Capital One Securities | | | Johnson Rice & Company L.L.C. | | | Raymond James |
| | | | ||||
Stifel | | | | | U.S. Capital Advisors |
| | | Page | |
| | | ||
| | | ||
| | | ||
| | | ||
| | | ||
| | | ||
| | | ||
| | | ||
| | | ||
| | | ||
| | | ||
| | | ||
| | | ||
| | | ||
| | | ||
| | | ||
| | | ||
| | | ||
| | | ||
| | | ||
| | | ||
| | | ||
| | |
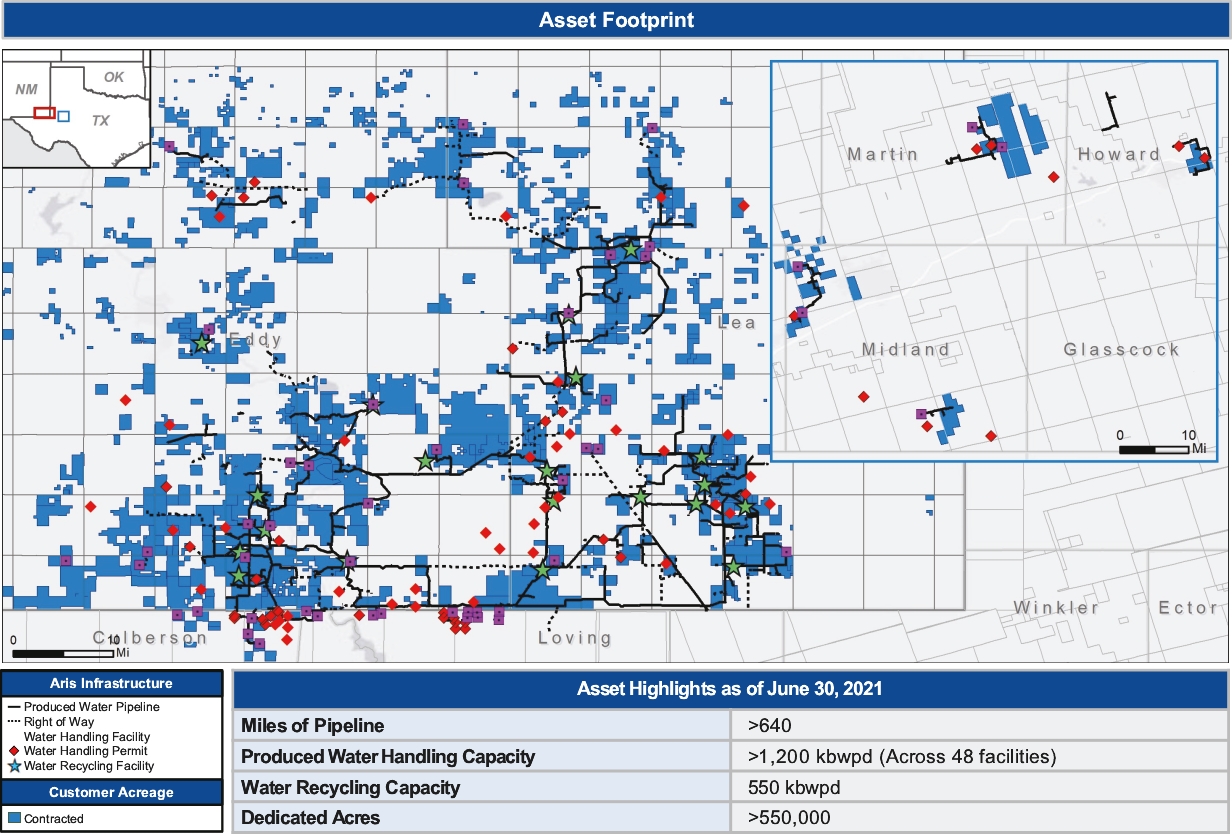
As of June 30, 2021 | | | Pipelines (miles) | | | Number of Water Handling Facilities | | | Water Handling Capacity (kbwpd) |
Installed | | | 640 | | | 48 | | | 1,232 |
As of June 30, 2021 | | | Pipelines (miles) | | | Number of Water Handling Facilities | | | Water Handling Capacity (kbwpd) |
Permitted Not Installed | | | 225 | | | 48 | | | 1,530 |
Volumes (kbwpd) | | | Six Months Ended June 30, 2021 | | | Year Ended December 31, 2020 |
Produced Water Handling Volumes | | | 684 | | | 570 |
As of June 30, 2021 | | | Number of Water Recycling Facilities | | | Water Recycling Capacity (kbwpd) |
Active Facilities | | | 10 | | | 550 |
As of June 30, 2021 | | | Number of Water Recycling Facilities | | | Water Recycling Capacity (kbwpd) |
Permitted or In Process Facilities | | | 14 | | | 950 |
Volumes (kbwpd) | | | Six Months Ended June 30, 2021 | | | Year Ended December 31, 2020 |
Recycled Produced Water Volumes Sold | | | 88 | | | 44 |
Percentage of Produced Water Handling Revenue(1) | | | Six Months Ended June 30, 2021 | | | Year Ended December 31, 2020 |
Acreage Dedication | | | 75% | | | 71% |
Minimum Volume Commitments | | | 17% | | | 21% |
Spot Volumes | | | 8% | | | 8% |
Total | | | 100% | | | 100% |
(1) | Produced Water Handling Revenue does not include skim oil sales. |
Acreage Dedications | | | As of June 30, 2021 |
Acreage Under Contract (thousands of acres) | | | 550 |
Weighted Average Remaining Life (years) | | | 9.7 |
| | | ||
Minimum Volume Commitments | | | |
Volumetric Commitment (kbwpd) | | | 162 |
Weighted Average Remaining Life (years) | | | 3.6 |
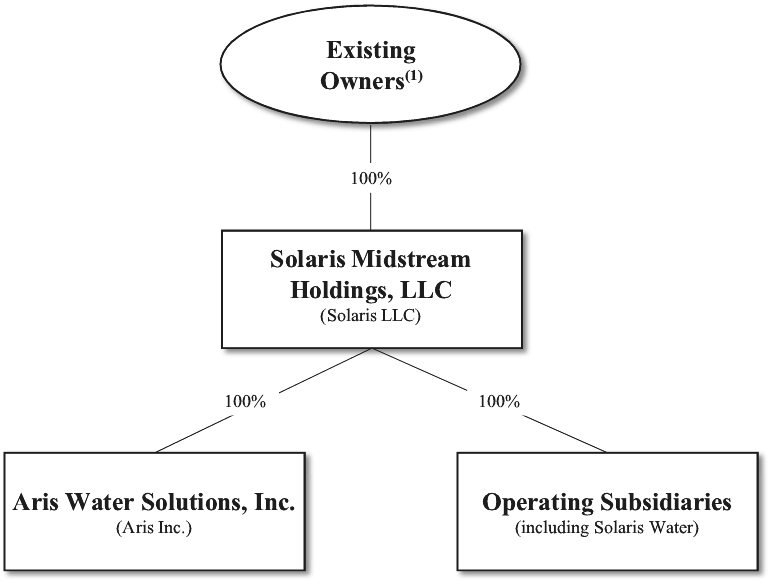
(1) | Includes ConocoPhillips, Trilantic, Yorktown, certain of our officers and directors and the other current members of Solaris LLC. |
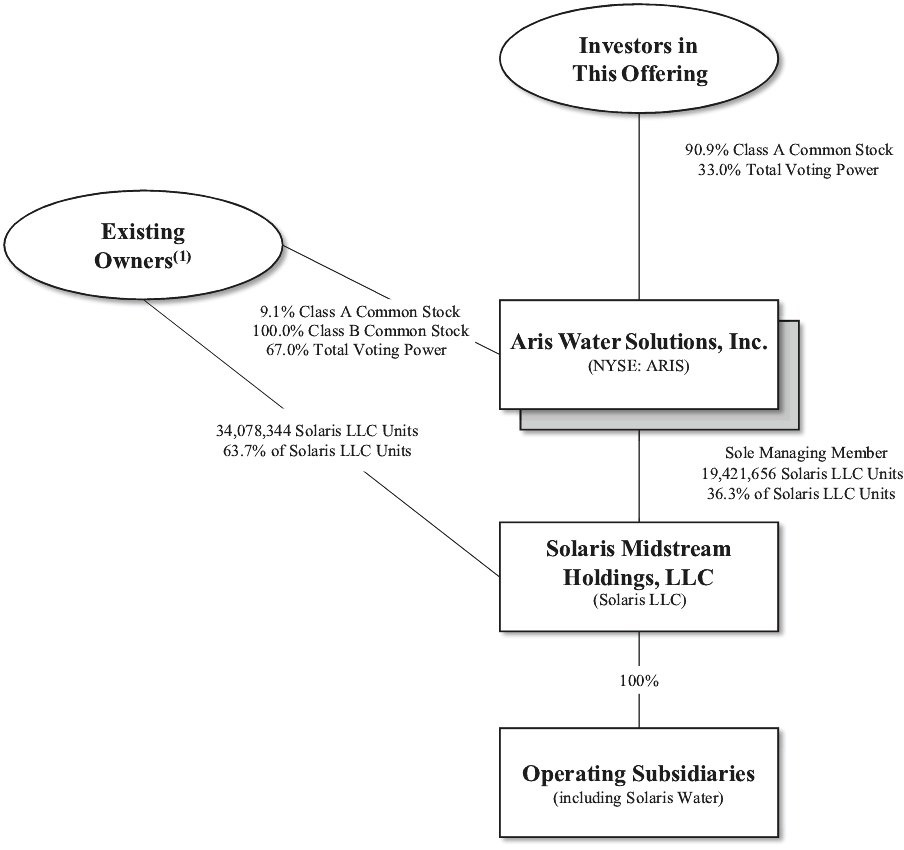
(1) | Includes ConocoPhillips, Trilantic, Yorktown, certain of our officers and directors and the other current members of Solaris LLC. See “Corporate Reorganization.” |
• | being permitted to provide only two years of audited financial statements, in addition to any required unaudited interim financial statements, with correspondingly reduced “Management’s Discussion and Analysis of Financial Condition and Results of Operations” disclosure; |
• | not being required to comply with the auditor attestation requirements in the assessment of our internal control over financial reporting; |
• | not being required to comply with any requirement that may be adopted by the Public Company Accounting Oversight Board regarding mandatory audit firm rotation or a supplement to the auditor’s report providing additional information about the audit and the financial statements; |
• | reduced disclosure obligations regarding executive compensation; and |
• | exemptions from the requirements of holding a nonbinding advisory vote on executive compensation and obtaining stockholder approval of any golden parachute payments not previously approved. |
• | Our business depends on capital spending by the oil and gas industry in the Permian Basin, which could be negatively impacted by the COVID-19 pandemic. |
• | The widespread outbreak of an illness or any other communicable disease, or any other public health crisis, such as the COVID-19 pandemic, could adversely affect our business. |
• | If oil prices or natural gas prices remain volatile or were to decline, the demand for our services could be adversely affected. |
• | We operate in a highly competitive industry, which could negatively affect our ability to expand our operations. |
• | Growing our business by constructing new transportation systems and facilities subjects us to construction risks. |
• | We may be unable to attract and retain key members of management, qualified members of our Board and other key personnel. |
• | We may be unable to implement price increases or maintain existing prices on our services. |
• | Inherent risks associated with our operations may not be fully covered under our insurance policies. |
• | The loss of one or more of our customers could adversely affect our business. |
• | Because a significant portion of our revenues is derived from ConocoPhillips, any development that materially and adversely affects ConocoPhillips’ operations, financial condition or market reputation could have a material adverse impact on us. |
• | Our lack of diversification increases the risk of an investment in us and we are vulnerable to risks associated with operating primarily in one geographic area. |
• | We could be harmed by a default of one of our customers. |
• | We may be required to take write-downs of the carrying values of certain assets and goodwill. |
• | Restrictive covenants under our debt instruments may limit our financial flexibility. |
• | Our leverage may limit our ability to borrow additional funds, comply with the terms of our indebtedness or capitalize on business opportunities. |
• | Increases in interest rates could adversely impact the price of our shares, our ability to issue equity or incur debt for acquisitions or other purposes. |
• | Restrictions on the ability to procure water could decrease the demand for our services. |
• | Legislation or regulatory initiatives intended to address seismic activity could restrict our ability to recycle or handle produced water. |
• | Fuel conservation measures could reduce demand for our services. |
• | We may be subject to claims for personal injury and property damage. |
• | Unsatisfactory safety performance may negatively affect our customer relationships. |
• | We are subject to environmental and occupational health and safety laws and regulations that may expose us to significant liabilities for penalties and other costs. |
• | Climate change legislation, laws, and regulations could have a material adverse effect on our financial condition, results of operations and cash flows, as well as our reputation. |
• | A portion of our customers’ oil and gas leases are granted by the federal government, which may suspend or terminate such leases. |
• | Laws and regulations related to hydraulic fracturing could result in increased costs and additional operating restrictions that may reduce demand for our services. |
• | Restrictions on drilling related to the protection of certain species of wildlife or their habitat could adversely affect our customer’s ability to conduct drilling and related activities in areas where we operate. |
• | We may face increased obligations relating to the closing of our water handling facilities. |
• | Delays or restrictions in obtaining or renewing permits by us for our operations or by our customers for their operations could impair our business. |
• | Our sole material asset after completion of this offering will be our equity interest in Solaris LLC and we will be accordingly dependent upon distributions from Solaris LLC to pay taxes and other expenses. |
• | The requirements of being a public company may strain our resources, increase our costs and distract management. |
• | If we fail to develop or maintain an effective system of internal controls, we may not be able to accurately report our financial results or prevent fraud. |
• | For as long as we are an emerging growth company, we will not be required to comply with certain reporting requirements that apply to other public companies. |
• | The initial public offering price of our Class A common stock may not be indicative of the market price of our Class A common stock after this offering. |
• | Certain of our directors have significant duties with, and spend significant time serving, entities that may compete with us in seeking acquisitions and business opportunities and, accordingly, may have conflicts of interest in allocating time or pursuing business opportunities. |
• | Our governing organizational documents, as well as Delaware law, will contain provisions that could discourage acquisition bids or merger proposals. |
• | Investors in this offering will experience immediate and substantial dilution of $12.13 per share. |
• | We cannot assure you that we will pay any dividends on our Class A common stock, and our indebtedness could limit our ability to pay dividends on our Class A common stock. |
• | The underwriters of this offering may waive or release parties to the lock-up agreements entered into in connection with this offering. |
• | Payments under the Tax Receivable Agreement may be accelerated and/or significantly exceed the actual benefits, if any, we realize in respect of the tax attributes subject to the Tax Receivable Agreement. |
• | We may issue preferred stock whose terms could adversely affect the voting power or value of our Class A common stock. |
• | A terrorist attack or political unrest in various energy producing regions could harm our business. |
• | We are subject to cybersecurity risks and may not be able to keep pace with technological developments in our industry. |
• | 2,647,500 shares of Class A common stock issuable upon exercise of the underwriters’ option to purchase additional shares; |
• | 5,350,000 shares of Class A common stock issuable under our 2021 Equity Incentive Plan (the “2021 Plan”), including: |
• | 632,353 shares of Class A common stock underlying restricted stock units or other awards that may be granted to certain employees and non-employee directors pursuant to the 2021 Plan after the closing of this offering, the terms of which have not been decided; and |
• | 4,717,647 additional shares of Class A common stock to be reserved for future issuance of awards under the 2021 Plan; and |
• | 34,078,344 shares of Class A common stock reserved for issuance upon exchange of the Solaris LLC Units (together with a corresponding number of shares of Class B common stock) that will be outstanding immediately after this offering. |
(Dollars in thousands) | | | Six Months Ended June 30, | | | Year Ended December 31, | ||||||
| | | 2021 | | | 2020 | | | 2020 | | | 2019 | |
| | | (unaudited) | | | | | ||||||
Statement of Operations Data: | | | | | | | | | ||||
Revenue: | | | | | | | | | ||||
Produced Water Handling | | | $85,810 | | | $69,031 | | | $141,659 | | | $81,418 |
Water Solutions | | | 16,963 | | | 15,061 | | | 29,813 | | | 37,375 |
Total revenues | | | 102,773 | | | 84,092 | | | 171,472 | | | 118,793 |
Cost of revenue: | | | | | | | | | ||||
Direct operating costs | | | 43,206 | | | 49,433 | | | 95,431 | | | 71,973 |
Depreciation, amortization and accretion | | | 30,172 | | | 19,778 | | | 44,027 | | | 19,670 |
Total cost of revenue | | | 73,378 | | | 69,211 | | | 139,458 | | | 91,643 |
Operating expenses: | | | | | | | | | ||||
General and administrative | | | 10,012 | | | 8,648 | | | 18,663 | | | 15,299 |
(Gain) loss on disposal of asset, net | | | 217 | | | 67 | | | 133 | | | (5,100) |
Transaction costs | | | 77 | | | 3,099 | | | 3,389 | | | 1,010 |
Abandoned projects | | | 1,356 | | | 1,133 | | | 2,125 | | | 2,444 |
Total operating expenses | | | 11,662 | | | 12,947 | | | 24,310 | | | 13,653 |
Operating income | | | 17,733 | | | 1,934 | | | 7,704 | | | 13,497 |
Other expense: | | | | | | | | | ||||
Other expense | | | 380 | | | — | | | — | | | 176 |
Interest expense, net | | | 9,975 | | | 3,265 | | | 7,674 | | | 260 |
Total other expense | | | 10,355 | | | 3,265 | | | 7,674 | | | 436 |
Income (loss) before taxes | | | 7,378 | | | (1,331) | | | 30 | | | 13,061 |
Income tax expense | | | 2 | | | 6 | | | 23 | | | 1 |
Net income (loss) | | | $7,376 | | | $(1,337) | | | $7 | | | $13,060 |
(Dollars in thousands, except per share and per barrel data) | | | Six Months Ended June 30, | | | Year Ended December 31, | ||||||
| | | 2021 | | | 2020 | | | 2020 | | | 2019 | |
| | | (unaudited) | | | | | ||||||
Pro Forma Statement of Operations Data(1) | | | | | | | | | ||||
Pro forma net income(2) | | | $6,746 | | | | | $4 | | | ||
Pro forma non-controlling interest(3) | | | 4,712 | | | | | (2,759) | | | ||
Pro forma net income (loss) attributable to common stockholders(2) | | | 2,055 | | | | | (1,572) | | | ||
Pro forma net income (loss) per share attributable to common stockholders(4) | | | | | | | | | ||||
Basic and diluted | | | $0.11 | | | | | $(0.08) | | | ||
Pro forma weighted average shares outstanding | | | | | | | | | ||||
Basic and diluted | | | 19,422 | | | | | 19,422 | | | ||
Balance Sheet Data (at end of period): | | | | | | | | | ||||
Cash and cash equivalents | | | $31,123 | | | $14,986 | | | $24,932 | | | $7,083 |
Accounts receivable, net | | | 25,928 | | | 22,893 | | | 21,561 | | | 33,523 |
Accounts receivable from affiliates | | | 18,346 | | | 12,086 | | | 11,538 | | | 15,837 |
Total current assets | | | 80,824 | | | 52,950 | | | 66,068 | | | 60,763 |
Total property, plant and equipment, net | | | 649,980 | | | 596,074 | | | 618,188 | | | 481,790 |
Total assets | | | 1,088,762 | | | 1,033,165 | | | 1,057,805 | | | 838,234 |
Total current liabilities | | | 49,366 | | | 53,679 | | | 45,789 | | | 69,166 |
Long-term debt, net | | | 391,115 | | | 280,000 | | | 297,000 | | | 220,000 |
Total liabilities | | | 447,445 | | | 339,418 | | | 349,512 | | | 292,726 |
Total mezzanine equity | | | — | | | 72,391 | | | 74,378 | | | — |
Total members’ equity | | | 641,317 | | | 621,356 | | | 633,915 | | | 545,508 |
Consolidated Statements of Cash Flows Data: | | | | | | | | | ||||
Operating activities | | | $30,690 | | | $40,911 | | | $67,771 | | | $4,149 |
Investing activities | | | (42,353) | | | (92,581) | | | (139,589) | | | (228,368) |
Financing activities | | | 17,854 | | | 59,572 | | | 89,667 | | | 223,959 |
Non-GAAP Measures: | | | | | | | | | ||||
Adjusted EBITDA(5) | | | $54,029 | | | $35,919 | | | $73,896 | | | $47,199 |
Adjusted Operating Margin(5) | | | $63,820 | | | $43,780 | | | $91,020 | | | $62,431 |
Adjusted Operating Margin per Barrel(5) | | | $0.41 | | | $0.36 | | | $0.36 | | | $0.35 |
Operating Data (kbwpd): | | | | | | | | | ||||
Produced Water Handling Volumes | | | 684 | | | 562 | | | 570 | | | 343 |
Recycled Produced Water Volumes Sold | | | 88 | | | 29 | | | 44 | | | 20 |
Groundwater Water Volumes Sold | | | 51 | | | 65 | | | 61 | | | 77 |
Total Water Solutions Volumes Sold | | | 139 | | | 94 | | | 105 | | | 97 |
Groundwater Water Volumes Transferred | | | 43 | | | 11 | | | 11 | | | 49 |
Total Water Solutions Volumes Sold or Transferred | | | 182 | | | 105 | | | 116 | | | 146 |
Total Volumes | | | 866 | | | 667 | | | 686 | | | 489 |
(1) | For additional information regarding our pro forma information, please see the pro forma financial statements and the related notes thereto appearing elsewhere in this prospectus. |
(2) | Pro forma net income reflects a pro forma income tax expense of $0.6 million and $3 thousand, respectively, for the six months ended June 30, 2021 and the year ended December 31, 2020, associated with the income tax effects of the corporate reorganization described under “Corporate Reorganization” and this offering. Aris Inc. is a corporation and is subject to U.S. federal and State of Texas income tax. Our predecessor, Solaris LLC, was not subject to U.S. federal income tax at an entity level. As a result, the consolidated net loss in our historical financial statements does not reflect the tax expense we would have incurred if we were subject to U.S. federal income tax at an entity level during such periods. |
(3) | Reflects the pro forma adjustment to non-controlling interest and net income (loss) attributable to common stockholders to reflect the ownership of Solaris LLC Units by each of the Existing Owners. |
(4) | Pro forma net income (loss) per share attributable to common stockholders and weighted average shares outstanding reflect the estimated number of shares of Class A common stock we expect to have outstanding upon the completion of our corporate reorganization described under “Corporate Reorganization.” Pro forma weighted average shares outstanding used to compute pro forma earnings per share for the six months ended June 30, 2021 and the year ended December 31, 2020 does not take into account any time-based restricted stock unit awards that may be granted after the closing of this offering since the terms of any such awards have not been determined. |
(5) | Adjusted EBITDA, Adjusted Operating Margin and Adjusted Operating Margin per Barrel are non-GAAP financial measures. Please read “—Non-GAAP Financial Measures” for additional information regarding these non-GAAP financial measures and a reconciliation to the most comparable GAAP measures of each. |
| | | Three Months Ended June 30, | | | Six Months Ended June 30, | | | Year Ended December 31, | ||||||||||
(Dollars in thousands) | | | 2021 | | | 2020 | | | 2021 | | | 2020 | | | 2020 | | | 2019 |
| | | (unaudited) | | | (unaudited) | | | | | |||||||||
Net income (loss) | | | $4,561 | | | $(931) | | | $7,376 | | | $(1,337) | | | $7 | | | $13,060 |
Interest expense, net | | | 7,324 | | | 1,675 | | | 9,975 | | | 3,265 | | | 7,674 | | | 260 |
Income tax expense | | | 2 | | | 2 | | | 2 | | | 6 | | | 23 | | | 1 |
Depreciation, amortization and accretion | | | 15,215 | | | 10,289 | | | 30,172 | | | 19,778 | | | 44,027 | | | 19,670 |
Abandoned projects | | | 1,145 | | | 498 | | | 1,356 | | | 1,133 | | | 2,125 | | | 2,444 |
Temporary power costs(1) | | | 1,604 | | | 3,898 | | | 4,253 | | | 9,121 | | | 14,979 | | | 15,611 |
(Gain) loss on sale of assets, net(2) | | | 173 | | | 67 | | | 217 | | | 67 | | | — | | | (5,173) |
Settled litigation(3) | | | — | | | 440 | | | — | | | 597 | | | 1,482 | | | 316 |
Transaction costs(4) | | | 15 | | | 1,352 | | | 77 | | | 3,099 | | | 3,389 | | | 1,010 |
Other(5) | | | 601 | | | 190 | | | 601 | | | 190 | | | 190 | | | — |
Adjusted EBITDA | | | $30,640 | | | $17,480 | | | $54,029 | | | $35,919 | | | $73,896 | | | $47,199 |
| | | Three Months Ended June 30, | | | Six Months Ended June 30, | | | Year Ended December 31, | ||||||||||
(Dollars in thousands, except per barrel data) | | | 2021 | | | 2020 | | | 2021 | | | 2020 | | | 2020 | | | 2019 |
| | | (unaudited) | | | (unaudited) | | | | | |||||||||
Gross margin(6) | | | $18,917 | | | $7,193 | | | $29,395 | | | $14,881 | | | $32,014 | | | $27,150 |
Depreciation, amortization and accretion | | | 15,215 | | | 10,289 | | | 30,172 | | | 19,778 | | | 44,027 | | | 19,670 |
Temporary power costs(1) | | | 1,604 | | | 3,898 | | | 4,253 | | | 9,121 | | | 14,979 | | | 15,611 |
Adjusted Operating Margin | | | $35,736 | | | $21,380 | | | $63,820 | | | $43,780 | | | $91,020 | | | $62,431 |
Total Volumes (mmbw) | | | 84 | | | 55 | | | 157 | | | 120 | | | 251 | | | 178 |
Adjusted Operating Margin per Barrel | | | $0.42 | | | $0.39 | | | $0.41 | | | $0.36 | | | $0.36 | | | $0.35 |
(1) | In the past, to secure long-term produced water handling contracts we constructed assets in advance of grid power infrastructure availability. As a result, we rented temporary power generation equipment that would not be necessary if grid power connections were available. Temporary power costs are calculated by taking temporary power and rental expenses incurred during the period and subtracting estimated expenses that would have been incurred during such period had permanent grid power been available. Power infrastructure and permanent power availability rapidly expanded in the Permian Basin in 2020 and the first quarter of 2021 and we made significant progress in reducing these expenses. Our temporary power expenses have been substantially eliminated as of the end of the second quarter of 2021. |
(2) | Includes gains and losses on sale of assets. |
(3) | Litigation is primarily related to a dispute regarding rights-of-way that was successfully settled in arbitration. Amounts represent legal expenses solely related to this dispute. |
(4) | Represents certain transaction expenses primarily related to certain advisory and legal expenses associated with a recapitalization process that was terminated in first quarter 2020 and the Concho Acquisitions (as defined herein). |
(5) | Represents severance charges and loss on debt modification. |
(6) | The following table sets forth the calculation of our gross margin for each of the periods presented: |
| | | Three Months Ended June 30, | | | Six Months Ended June 30, | | | Year Ended December 31, | ||||||||||
(Dollars in thousands) | | | 2021 | | | 2021 | | | 2021 | | | 2020 | | | 2020 | | | 2019 |
| | | (unaudited) | | | (unaudited) | | | | | |||||||||
Revenues | | | $56,584 | | | $37,645 | | | $102,773 | | | $84,092 | | | $171,472 | | | $118,793 |
Cost of revenue | | | (37,667) | | | (30,452) | | | (73,378) | | | (69,211) | | | (139,458) | | | (91,643) |
Gross margin (GAAP) | | | $18,917 | | | $7,193 | | | $29,395 | | | $14,881 | | | $32,014 | | | $27,150 |
• | the severity and duration of world health events, including the COVID-19 pandemic, related economic repercussions and the resulting severe disruption in the oil and gas industry and negative impact on demand for oil and gas, which negatively impacts the demand for our services; |
• | domestic and foreign economic conditions and supply of and demand for oil and gas; |
• | the level of prices, and expectations regarding future prices, of oil and gas; |
• | the level of global oil and gas exploration and production and storage capacity; |
• | operational challenges relating to the COVID-19 pandemic and efforts to mitigate the spread of the virus, including logistical challenges resulting from limited worksite access, remote work arrangements, performance of contracts and supply chain disruption; |
• | recommendations of, or restrictions imposed by, government and health authorities, including travel bans, quarantines, and shelter-in-place orders to address the COVID-19 pandemic; |
• | actions by the members of OPEC+ with respect to oil production levels and announcements of potential changes in such levels, including the ability of the OPEC+ countries to agree on and comply with supply limitations; |
• | governmental regulations, including environmental restrictions and the policies of governments regarding the exploration for and production and development of their oil and gas reserves; |
• | taxation and royalty charges; |
• | political and economic conditions in oil and gas producing countries; |
• | global weather conditions, pandemics and natural disasters; |
• | worldwide political, military and economic conditions; |
• | the cost of producing and delivering oil and gas; |
• | the discovery rates of new oil and gas reserves and the availability of commercially viable geographic areas in which to explore and produce crude oil and natural gas; |
• | activities by non-governmental organizations to limit certain sources of funding for the energy sector or restrict the exploration, development and production of oil and gas; |
• | the ability of oil and gas producers to access capital; |
• | technical advances affecting production efficiencies and overall energy consumption; and |
• | the potential acceleration of the development of alternative fuels. |
• | unanticipated costs and assumption of liabilities and exposure to unforeseen liabilities of the acquired business, including but not limited to environmental liabilities; |
• | difficulties in integrating the operations and assets of the acquired business and the acquired personnel; |
• | limitations on our ability to properly assess and maintain an effective internal control environment over an acquired business; |
• | potential losses of key employees and customers of the acquired business; |
• | risks of entering markets in which we have limited prior experience; and |
• | increases in our expenses and working capital requirements. |
• | disruption in operations; |
• | substantial repair or remediate costs; |
• | personal injury or loss of human life; |
• | significant damage to or destruction of property, plant and equipment; |
• | environmental pollution, including groundwater contamination; |
• | impairment or suspension of operations; and |
• | substantial revenue loss. |
• | incur indebtedness; |
• | grant liens; |
• | engage in mergers, consolidations and liquidations; |
• | make asset dispositions, restricted payments and investments; |
• | enter into transactions with affiliates; and |
• | amend, modify or prepay certain indebtedness. |
• | institute a more comprehensive compliance function; |
• | comply with rules promulgated by the NYSE; |
• | continue to prepare and distribute periodic public reports in compliance with our obligations under the federal securities laws; |
• | establish new internal policies, such as those relating to insider trading; and |
• | involve and retain to a greater degree outside counsel and accountants in the above activities. |
• | quarterly variations in our financial and operating results; |
• | the public reaction to our press releases, our other public announcements and our filings with the SEC; |
• | strategic actions by our competitors; |
• | changes in revenue or earnings estimates, or changes in recommendations or withdrawal of research coverage, by equity research analysts; |
• | speculation in the press or investment community; |
• | the failure of research analysts to cover our Class A common stock; |
• | sales of our Class A common stock by us or other stockholders, or the perception that such sales may occur; |
• | changes in accounting principles, policies, guidance, interpretations or standards; |
• | additions or departures of key management personnel; |
• | actions by our stockholders; |
• | general market conditions, including fluctuations in commodity prices; |
• | domestic and international economic, legal and regulatory factors unrelated to our performance; and |
• | the realization of any risks described under this “Risk Factors” section. |
• | permit such Designated Parties to conduct business that competes with us and to make investments in any kind of property in which we may make investments; and |
• | provide that if such Designated Parties, or any employee, partner, member, manager, officer or director of such Designated Parties who is also one of our directors, becomes aware of a potential business opportunity, transaction or other matter, they will have no duty to communicate or offer that opportunity to us. |
• | dividing our Board into three classes of directors, with each class serving staggered three-year terms; |
• | providing that all vacancies, including newly created directorships, shall, except as otherwise required by law or, if applicable, the rights of holders of a series of preferred stock, only be filled by the affirmative vote of a majority of directors then in office, even if less than a quorum (prior to such time, vacancies may also be filled by stockholders holding a majority of the outstanding shares); |
• | permitting any action by stockholders to be taken only at an annual meeting or special meeting rather than by a written consent of the stockholders, subject to the rights of any series of preferred stock with respect to such rights; |
• | permitting special meetings of our stockholders to be called only by our Board pursuant to a resolution adopted by the affirmative vote of a majority of the total number of authorized directors whether or not there exist any vacancies in previously authorized directorships; |
• | requiring the affirmative vote of the holders of at least 66-2/3% in voting power of all then outstanding common stock entitled to vote generally in the election of directors, voting together as a single class, to remove any or all of the directors from office at any time, and directors will be removable only for “cause”; |
• | prohibiting cumulative voting in the election of directors; |
• | establishing advance notice provisions for stockholder proposals and nominations for elections to the Board to be acted upon at meetings of stockholders; |
• | Requiring the approval of the affirmative vote of the holders of at least 66-2/3% of all then outstanding common stock entitled to vote thereon, voting together as a single class, to amend certain provisions of the amended and restated certificate of incorporation and amended and restated bylaws; and |
• | providing that the Board is expressly authorized to adopt, or to alter or repeal our bylaws. |
• | the severity and duration of world health events, including the novel coronavirus (“COVID-19”) pandemic, which has caused reduced demand for oil and natural gas, economic slowdowns, governmental actions, stay-at-home orders, and interruptions to our operations or our exploration and production (“E&P”) customers’ operations; |
• | operational challenges relating to the COVID-19 pandemic and efforts to mitigate the spread of the virus, including logistical challenges, protecting the health and well-being of our employees, remote work arrangements, performance of contracts and supply chain disruptions; |
• | the potential deterioration of our customers’ financial condition, including defaults resulting from actual or potential insolvencies; |
• | the level of capital spending and development by oil and gas companies, including significant recent reductions and potential additional reductions in capital expenditures by oil and gas producers in response to commodity prices and dramatically reduced demand; |
• | the impact of current and future laws, rulings and federal and state governmental regulations, including those related to hydraulic fracturing, accessing water, handling of produced water, carbon pricing, taxation or emissions, drilling and right-of-way access on federal lands and various other matters; |
• | the degree to which consolidation among our customers may affect spending on U.S. drilling and completions in the near-term; |
• | our reliance on a limited number of customers and a particular region for substantially all of our revenues; |
• | our ability to successfully implement our business plan; |
• | regional impacts to our business, including our infrastructure assets within the Delaware Basin and Midland Basin formations of the Permian Basin; |
• | our access to capital to fund expansions, acquisitions and our working capital needs and our ability to obtain debt or equity financing on satisfactory terms; |
• | our ability to renew or replace expiring contracts on acceptable terms; |
• | our ability to comply with covenants contained in our debt instruments; |
• | changes in general economic conditions and commodity prices; |
• | our customers’ ability to complete and produce new wells; |
• | risks related to acquisitions and organic growth projects, including our ability to realize their expected benefits; |
• | capacity constraints on regional oil, natural gas and water gathering, processing and pipeline systems that result in a slowdown or delay in drilling and completion activity, and thus a slowdown or delay in the demand for our services; |
• | our ability to retain key management and employees and to hire and retain skilled labor; |
• | our health, safety and environmental performance; |
• | the impact of competition on our operations; |
• | the degree to which our E&P customers may elect to operate their water-management services in-house rather than outsource these services to companies like us; |
• | delays or restrictions in obtaining, utilizing or maintaining permits by us or our customers; |
• | constraints in supply or availability of equipment used in our business; |
• | advances in technologies or practices that reduce the amount of water used or produced in the oil and gas production process, thereby reducing demand for our services; |
• | changes in global political or economic conditions, generally, and in the markets we serve; |
• | physical, electronic and cybersecurity breaches; |
• | accidents, weather, seasonality or other events affecting our business; |
• | changes in tax laws, regulations or policies; |
• | the effects of litigation; and |
• | plans, objectives, expectations and intentions contained in this report that are not historical. |
Distributions to Existing Owners | | | $236.3 |
Underwriting discounts and commissions | | | 18.0 |
Offering expenses | | | 1.9 |
Retained proceeds | | | 43.9 |
Total gross proceeds | | | $300.1 |
• | on an actual basis; and |
• | on an as adjusted basis after giving effect to (i) the transactions described under “Corporate Reorganization,” (ii) the sale of shares of our Class A common stock in this offering at the assumed initial offering price of $17.00 per share (the midpoint of the range set forth on the cover of this prospectus), and (iii) the application of the net proceeds from this offering as set forth under “Use of Proceeds.” |
| | | As of June 30, 2021 | ||||
(Dollars in thousands, except par values) | | | Actual | | | As Adjusted |
Cash and cash equivalents | | | $31,123 | | | $71,773(1) |
Long-term debt: | | | | | ||
Credit Facility | | | $— | | | $— |
7.625% Senior Sustainability-Linked Notes | | | 400,000 | | | $400,000 |
Unamortized deferred financing costs | | | (8,885) | | | (8,885) |
Total long-term debt | | | $391,115 | | | $391,115 |
Members’/Stockholders’ equity: | | | | | ||
Members’ equity | | | $641,317 | | | $— |
Class A common stock, $0.01 par value; no shares authorized, issued or outstanding (Actual); 600,000,000 shares authorized, 19,421,656 shares issued and outstanding (As Adjusted) | | | — | | | 194 |
Class B common stock, no par value; no shares authorized, issued or outstanding (Actual); 180,000,000 shares authorized, 34,078,344 shares issued and outstanding (As Adjusted) | | | — | | | — |
Additional paid-in capital | | | — | | | 181,806 |
Total members’/stockholders’ equity | | | $641,317 | | | $182,000 |
Non-controlling interest | | | — | | | 434,345 |
Total capitalization | | | $1,032,432 | | | $1,007,460 |
(1) | Includes the effect of an expected payment of a transaction bonus of $3.25 million to officers and other employees in connection with this offering paid out of cash on hand. |
Initial public offering price per share | | | | | $17.00 | |
Pro forma net tangible book value per share as of June 30, 2021 (after giving effect to our corporate reorganization) | | | $5.34 | | | |
Decrease per share attributable to new investors in this offering | | | (0.47) | | | |
As adjusted pro forma net tangible book value per share after giving further effect to this offering | | | | | 4.87 | |
Dilution in pro forma net tangible book value per share to new investors in this offering(1) | | | | | $12.13 |
(1) | If the initial public offering price were to increase or decrease by $1.00 per share, then dilution in pro forma net tangible book value per share to new investors in this offering would equal $11.84 or $12.43, respectively. |
| | | Shares Acquired(1) | | | Total Consideration(2) | | | Average Price Per Share | |||||||
| | | Number | | | Percent | | | Amount | | | Percent | | |||
Existing Owners | | | 35,850 | | | 67.0% | | | $623,334 | | | 67.5% | | | $17.39 |
New investors in this offering | | | 17,650 | | | 33.0% | | | 300,050 | | | 32.5% | | | $17.00 |
Total | | | 53,500 | | | 100.0% | | | $923,384 | | | 100.0% | | | $17.26 |
(1) | If the underwriters exercise their option to purchase additional shares in full, our Existing Owners would own approximately 62.1% and our new investors in this offering would own approximately 37.9% of the total number of shares of our Class A common stock outstanding after this offering. |
(2) | If the underwriters exercise their option to purchase additional shares in full, the total consideration paid by our new investors would be approximately $345,000 (or 35.6%). |
(Dollars in thousands) | | | Six Months Ended June 30, | | | Year Ended December 31, | ||||||
| | | 2021 | | | 2020 | | | 2020 | | | 2019 | |
| | | (unaudited) | | | | | ||||||
Statement of Operations Data: | | | | | | | | | ||||
Revenue: | | | | | | | | | ||||
Produced Water Handling | | | $85,810 | | | $69,031 | | | $141,659 | | | $81,418 |
Water Solutions | | | 16,963 | | | 15,061 | | | 29,813 | | | 37,375 |
Total revenues | | | 102,773 | | | 84,092 | | | 171,472 | | | 118,793 |
Cost of revenue: | | | | | | | | | ||||
Direct operating costs | | | 43,206 | | | 49,433 | | | 95,431 | | | 71,973 |
Depreciation, amortization and accretion | | | 30,172 | | | 19,778 | | | 44,027 | | | 19,670 |
Total cost of revenue | | | 73,378 | | | 69,211 | | | 139,458 | | | 91,643 |
(Dollars in thousands) | | | Six Months Ended June 30, | | | Year Ended December 31, | ||||||
| | | 2021 | | | 2020 | | | 2020 | | | 2019 | |
| | | (unaudited) | | | | | ||||||
Operating expenses: | | | | | | | | | ||||
General and administrative | | | 10,012 | | | 8,648 | | | 18,663 | | | 15,299 |
(Gain) loss on disposal of asset, net | | | 217 | | | 67 | | | 133 | | | (5,100) |
Transaction costs | | | 77 | | | 3,099 | | | 3,389 | | | 1,010 |
Abandoned projects | | | 1,356 | | | 1,133 | | | 2,125 | | | 2,444 |
Total operating expenses | | | 11,662 | | | 12,947 | | | 24,310 | | | 13,653 |
Operating income | | | 17,733 | | | 1,934 | | | 7,704 | | | 13,497 |
Other expense: | | | | | | | | | ||||
Other expense | | | 380 | | | — | | | — | | | 176 |
Interest expense, net | | | 9,975 | | | 3,265 | | | 7,674 | | | 260 |
Total other expense | | | 10,355 | | | 3,265 | | | 7,674 | | | 436 |
Income (loss) before taxes | | | 7,378 | | | (1,331) | | | 30 | | | 13,061 |
Income tax expense | | | 2 | | | 6 | | | 23 | | | 1 |
Net income (loss) | | | $7,376 | | | $(1,337) | | | $7 | | | $13,060 |
(Dollars in thousands, except per share and per barrel data) | | | Six Months Ended June 30, | | | Year Ended December 31, | ||||||
| | | 2021 | | | 2020 | | | 2020 | | | 2019 | |
| | | (unaudited) | | | | | ||||||
Pro Forma Statement of Operations Data(1) | | | | | | | | | ||||
Pro forma net income (loss)(2) | | | $6,746 | | | | | $4 | | | ||
Pro forma non-controlling interest(3) | | | 4,712 | | | | | (2,759) | | | ||
Pro forma net income (loss) attributable to common stockholders(2) | | | 2,055 | | | | | (1,572) | | | ||
Pro forma net income (loss) per share attributable to common stockholders(4) | | | | | | | | | ||||
Basic and Diluted | | | $0.11 | | | | | $(0.08) | | | ||
Pro forma weighted average shares outstanding | | | | | | | | | ||||
Basic and Diluted | | | 19,422 | | | | | 19,422 | | | ||
Balance Sheet Data (at end of period): | | | | | | | | | ||||
Cash and cash equivalents | | | $31,123 | | | $14,986 | | | $24,932 | | | $7,083 |
Accounts receivable, net | | | 25,928 | | | 22,893 | | | 22,457 | | | 33,523 |
Accounts receivable from affiliates | | | 18,346 | | | 12,086 | | | 10,642 | | | 15,837 |
Total current assets | | | 80,824 | | | 52,950 | | | 66,068 | | | 60,763 |
Total property, plant and equipment, net | | | 649,980 | | | 596,074 | | | 618,188 | | | 481,790 |
Total assets | | | $1,088,762 | | | 1,033,165 | | | 1,057,805 | | | 838,234 |
Total current liabilities | | | 49,366 | | | 53,679 | | | 45,789 | | | 69,166 |
Long-term debt, net | | | 391,115 | | | 280,000 | | | 297,000 | | | 220,000 |
Total liabilities | | | 447,445 | | | 339,418 | | | 349,512 | | | 292,726 |
Total mezzanine equity | | | — | | | 72,391 | | | 74,378 | | | — |
Total members’ equity | | | 641,317 | | | 621,356 | | | 633,915 | | | 545,508 |
Consolidated Statements of Cash Flows Data: | | | | | | | | | ||||
Operating activities | | | 30,690 | | | $40,911 | | | $67,771 | | | $4,149 |
Investing activities | | | (42,353) | | | (92,581) | | | (139,589) | | | (228,368) |
Financing activities | | | 17,854 | | | 59,572 | | | 89,667 | | | 223,959 |
(Dollars in thousands, except per share and per barrel data) | | | Six Months Ended June 30, | | | Year Ended December 31, | ||||||
| | | 2021 | | | 2020 | | | 2020 | | | 2019 | |
| | | (unaudited) | | | | | ||||||
Non-GAAP Measures | | | | | | | | | ||||
Net income (loss) | | | $7,376 | | | $(1,337) | | | $7 | | | $13,060 |
Interest expense, net | | | 9,975 | | | 3,265 | | | 7,674 | | | 260 |
Income tax expense | | | 2 | | | 6 | | | 23 | | | 1 |
Depreciation, amortization and accretion | | | 30,172 | | | 19,778 | | | 44,027 | | | 19,670 |
Abandoned projects | | | 1,356 | | | 1,133 | | | 2,125 | | | 2,444 |
Temporary power costs(5) | | | 4,253 | | | 9,121 | | | 14,979 | | | 15,611 |
(Gain) loss on sale of assets, net(6) | | | 217 | | | 67 | | | — | | | (5,173) |
Settled litigation(7) | | | — | | | 597 | | | 1,482 | | | 316 |
Transaction costs(8) | | | 77 | | | 3,099 | | | 3,389 | | | 1,010 |
Other(9) | | | 601 | | | 190 | | | 190 | | | — |
Adjusted EBITDA | | | $54,029 | | | $35,919 | | | $73,896 | | | $47,199 |
| | | | | | | | | |||||
Gross margin | | | $29,395 | | | $14,881 | | | $32,014 | | | $27,150 |
Depreciation, amortization and accretion | | | 30,172 | | | 19,778 | | | 44,027 | | | 19,670 |
Temporary power costs(5) | | | 4,253 | | | 9,121 | | | 14,979 | | | 15,611 |
Adjusted Operating Margin | | | $63,820 | | | $43,780 | | | $91,020 | | | $62,431 |
(1) | For additional information regarding our pro forma information, please see the pro forma financial statements and the related notes thereto appearing elsewhere in this prospectus. |
(2) | Pro forma net loss reflects a pro forma income tax expense of $0.6 million and $3 thousand, respectively, for the six months ended June 30, 2021 and the year ended December 31, 2020, associated with the income tax effects of the corporate reorganization described under “Corporate Reorganization” and this offering. Aris Inc. is a corporation and is subject to U.S. federal and State of Texas income tax. Our predecessor, Solaris LLC, was not subject to U.S. federal income tax at an entity level. As a result, the consolidated net loss in our historical financial statements does not reflect the tax expense we would have incurred if we were subject to U.S. federal income tax at an entity level during such periods. |
(3) | Reflects the pro forma adjustment to non-controlling interest and net income (loss) attributable to common stockholders to reflect the ownership of Solaris, LLC Units by each of the Existing Owners. |
(4) | Pro forma net loss per share attributable to common stockholders and weighted average shares outstanding reflect the estimated number of shares of Class A common stock we expect to have outstanding upon the completion of our corporate reorganization described under “Corporate Reorganization.” Pro forma weighted average shares outstanding used to compute pro forma earnings per share for the six months ended June 30, 2021 and the year ended December 31, 2020 does not take into account any time-based restricted stock unit awards that may be granted after the closing of this offering since the terms of any such awards have not been determined. |
(5) | In the past, we constructed assets in advance of grid power infrastructure availability to secure long-term produced water handling contracts. As a result, we rented temporary power generation equipment that would not be necessary if grid power connections were available. Temporary power costs are calculated by taking temporary power and rental expenses incurred during the period and subtracting estimated expenses that would have been incurred during such period had permanent grid power been available. Power infrastructure and permanent power availability rapidly expanded in the Permian Basin in 2020 and the first quarter of 2021 and we made significant progress in reducing these expenses. Our temporary power expenses have been substantially eliminated as of the end of the second quarter of 2021. |
(6) | Includes gains and losses on sale of assets. |
(7) | Litigation is primarily related to a dispute regarding rights-of-way that we successfully settled in arbitration. Amount represents legal expenses solely related to this dispute. |
(8) | Represents certain transaction expenses primarily related to certain advisory and legal expenses associated with a recapitalization process that was terminated in first quarter 2020 and the Concho Acquisitions (as defined herein). |
(9) | Represents severance charge and loss on debt modification. |
(Dollars in thousands, except per barrel data) | | | Six Months Ended June 30, | | | Year Ended December 31, | ||||||
| | | 2021 | | | 2020 | | | 2020 | | | 2019 | |
Operating Metrics: | | | | | | | | | ||||
Produced Water Handling Volumes (kbwpd) | | | 684 | | | 562 | | | 570 | | | 343 |
Recycled Produced Water Volumes Sold (kbwpd) | | | 88 | | | 29 | | | 44 | | | 20 |
Groundwater Volumes Sold (kbwpd) | | | 51 | | | 65 | | | 61 | | | 77 |
Groundwater Volumes Transferred (kbwpd) | | | 43 | | | 11 | | | 11 | | | 49 |
Total Water Solutions Volumes (kbwpd) | | | 182 | | | 105 | | | 116 | | | 146 |
Total Volumes (kbwpd) | | | 866 | | | 667 | | | 686 | | | 489 |
| | | | | | | | | |||||
Recycled Produced Water Volumes Sold (kbwpd) | | | 88 | | | 29 | | | 44 | | | 20 |
Groundwater Volumes Sold (kbwpd) | | | 51 | | | 65 | | | 61 | | | 77 |
Total Water Solutions Volumes Sold (kbwpd) | | | 139 | | | 94 | | | 105 | | | 97 |
| | | | | | | | | |||||
Produced Water Handling Revenue per Barrel | | | $0.69 | | | $0.67 | | | $0.68 | | | $0.65 |
Water Solutions Revenue per Barrel | | | $0.51 | | | $0.79 | | | $0.70 | | | $0.70 |
Revenue per Barrel of Total Volumes Handled, Sold or Transferred | | | $0.66 | | | $0.69 | | | $0.68 | | | $0.67 |
Temporary Power Costs | | | $4,253 | | | $9,121 | | | $14,979 | | | $15,611 |
Adjusted Operating Margin(1) | | | $63,820 | | | $43,780 | | | $91,020 | | | $62,431 |
Total Volumes (mmbw) | | | 157 | | | 120 | | | 251 | | | 178 |
Adjusted Operating Margin per Barrel(1) | | | $0.41 | | | $0.36 | | | $0.36 | | | $0.35 |
(1) | Adjusted Operating Margin and Adjusted Operating Margin per Barrel are non-GAAP financial measures. Please read “Prospectus Summary—Non-GAAP Financial Measures” for additional information regarding these non-GAAP financial measures and a reconciliation to the most comparable GAAP measures of each. |
| | | Six Months Ended June 30, | | | Amount of Increase (Decrease) | | | Percentage Change | ||||
(Dollars in thousands) | | | 2021 | | | 2020 | | |||||
| | | (unaudited) | | | | | ||||||
Statement of Operations Data: | | | | | | | | | ||||
Revenue: | | | | | | | | | ||||
Produced Water Handling | | | $85,810 | | | $69,031 | | | $16,779 | | | 24.3% |
Water Solutions | | | 16,963 | | | 15,061 | | | 1,902 | | | 12.6% |
Total revenues | | | 102,773 | | | 84,092 | | | 18,681 | | | 22.2% |
Cost of revenue: | | | | | | | | | ||||
Direct operating costs | | | 43,206 | | | 49,433 | | | (6,227) | | | (12.6%) |
Depreciation, amortization and accretion | | | 30,172 | | | 19,778 | | | 10,394 | | | 52.6% |
Total cost of revenue | | | 73,378 | | | 69,211 | | | 4,167 | | | 6.0% |
Operating costs and expenses: | | | | | | | | | ||||
General and administrative | | | 10,012 | | | 8,648 | | | 1,364 | | | 15.8% |
Loss on disposal of asset, net | | | 217 | | | 67 | | | 150 | | | 223.9% |
Transaction costs | | | 77 | | | 3,099 | | | (3,022) | | | (97.5%) |
Abandoned projects | | | 1,356 | | | 1,133 | | | 233 | | | 19.7% |
Total operating expenses | | | 11,662 | | | 12,947 | | | (1,285) | | | (9.9%) |
Operating income | | | 17,733 | | | 1,934 | | | 15,799 | | | 816.9% |
Other expense: | | | | | | | | | ||||
Other expense | | | 380 | | | — | | | 380 | | | |
Interest expense, net | | | 9,975 | | | 3,265 | | | 6,710 | | | 205.5% |
Total other expense | | | 10,355 | | | 3,265 | | | 7,090 | | | 217.2% |
Income (loss) before taxes | | | 7,378 | | | (1,331) | | | 8,709 | | | 654.3% |
Income tax expense | | | 2 | | | 6 | | | (4) | | | (66.7%) |
Net income (loss) | | | $7,376 | | | $(1,337) | | | $8,713 | | | 651.7% |
| | | Year Ended December 31, | | | Amount of Increase (Decrease) | | | Percentage Change | ||||
(Dollars in thousands) | | | 2020 | | | 2019 | | |||||
Statement of Operations Data: | | | | | | | | | ||||
Revenue: | | | | | | | | | ||||
Produced Water Handling | | | $141,659 | | | $81,418 | | | $60,241 | | | 74.0% |
Water Solutions | | | 29,813 | | | 37,375 | | | (7,562) | | | (20.2%) |
Total revenues | | | 171,472 | | | 118,793 | | | 52,679 | | | 44.3% |
Cost of revenue: | | | | | | | | | ||||
Direct operating costs | | | 95,431 | | | 71,973 | | | 23,458 | | | 32.6% |
Depreciation, amortization and accretion | | | 44,027 | | | 19,670 | | | 24,357 | | | 123.8% |
Total cost of revenue | | | 139,458 | | | 91,643 | | | 47,815 | | | 52.2% |
| | | Year Ended December 31, | | | Amount of Increase (Decrease) | | | Percentage Change | ||||
(Dollars in thousands) | | | 2020 | | | 2019 | | |||||
Operating expenses: | | | | | | | | | ||||
General and administrative | | | 18,663 | | | 15,299 | | | 3,364 | | | 22.0% |
(Gain) loss on disposal of asset, net | | | 133 | | | (5,100) | | | 5,233 | | | (102.6%) |
Transaction costs | | | 3,389 | | | 1,010 | | | 2,379 | | | 235.5% |
Abandoned projects | | | 2,125 | | | 2,444 | | | (319) | | | (13.1%) |
Total operating expenses | | | 24,310 | | | 13,653 | | | 10,657 | | | 78.1% |
Operating income | | | 7,704 | | | 13,497 | | | (5,793) | | | (42.9%) |
Other expense: | | | | | | | | | ||||
Other expense | | | — | | | 176 | | | (176) | | | (100.0%) |
Interest expense | | | 7,674 | | | 260 | | | 7,414 | | | 2,851.5% |
Total other expense | | | 7,674 | | | 436 | | | 7,238 | | | 1,660.1% |
Income before taxes | | | 30 | | | 13,061 | | | (13,031) | | | (99.8%) |
Income tax expense | | | 23 | | | 1 | | | 22 | | | 2,200.0% |
Net income | | | $7 | | | $13,060 | | | $(13,053) | | | (99.9%) |
| | | Year Ended December 31, | ||||
(Dollars in thousands) | | | 2020 | | | 2019 |
Depreciation expense | | | $23,388 | | | $13,450 |
Amortization expense | | | $20,413 | | | $6,075 |
Accretion expense | | | $226 | | | $145 |
Total | | | $44,027 | | | $19,670 |
• | incur or guarantee additional indebtedness or issue certain preferred stock; |
• | pay dividends on capital stock or redeem, repurchase or retire our capital stock or subordinated indebtedness; |
• | transfer or sell assets; |
• | make investments; |
• | create certain liens; |
• | enter into agreements that restrict dividends or other payments from our restricted subsidiaries to us; |
• | consolidate, merge or transfer all or substantially all of our assets; |
• | engage in transactions with affiliates; and |
• | create unrestricted subsidiaries. |
As of June 30, 2021 | | | Pipelines (miles) | | | Number of Water Handling Facilities | | | Water Handling Capacity (kbwpd) |
Installed | | | 640 | | | 48 | | | 1,232 |
As of June 30, 2021 | | | Pipelines (miles) | | | Number of Water Handling Facilities | | | Water Handling Capacity (kbwpd) |
Permitted Not Installed | | | 225 | | | 48 | | | 1,530 |
Volumes (kbwpd) | | | Six Months Ended June 30, 2021 | | | Year Ended December 31, 2020 |
Produced Water Handling Volumes | | | 684 | | | 570 |
As of June 30, 2021 | | | Number of Water Recycling Facilities | | | Water Recycling Capacity (kbwpd) |
Active Facilities | | | 10 | | | 550 |
As of June 30, 2021 | | | Number of Water Recycling Facilities | | | Water Recycling Capacity (kbwpd) |
Permitted or In Process Facilities | | | 14 | | | 950 |
Volumes (kbwpd) | | | Six Months Ended June 30, 2021 | | | Year Ended December 31, 2020 |
Recycled Produced Water Volumes Sold | | | 88 | | | 44 |
Percentage of Produced Water Handling Revenue | | | Six Months Ended June 30, 2021 | | | Year Ended December 31, 2020 |
Acreage Dedication | | | 75% | | | 71% |
Minimum Volume Commitments | | | 17% | | | 21% |
Spot Volumes | | | 8% | | | 8% |
Total | | | 100% | | | 100% |
Acreage Dedications | | | As of June 30, 2021 |
Acreage Under Contract (thousands of acres) | | | 550 |
Weighted Average Remaining Life (years) | | | 9.7 |
| | | ||
Minimum Volume Commitments | | | |
Volumetric Commitment (kbwpd) | | | 162 |
Weighted Average Remaining Life (years) | | | 3.6 |
Name | | | Age | | | Position |
William A. Zartler | | | 56 | | | Founder and Executive Chairman |
Amanda M. Brock | | | 60 | | | President and Chief Executive Officer and Director |
Brenda R. Schroer | | | 45 | | | Chief Financial Officer |
Joseph Colonnetta | | | 59 | | | Director Nominee |
Debra G. Coy | | | 63 | | | Director Nominee |
W. Howard Keenan, Jr. | | | 70 | | | Director Nominee |
Christopher Manning | | | 53 | | | Director Nominee |
Andrew O’Brien | | | 47 | | | Director Nominee |
Donald C. Templin | | | 58 | | | Director Nominee |
M. Max Yzaguirre | | | 61 | | | Director Nominee |
• | William A. Zartler, our Founder and Executive Chairman; |
• | Amanda M. Brock, our President and Chief Executive Officer and Director; and |
• | Chris B. Work, our former Chief Financial Officer. |
Name and Principal Position | | | Year | | | Salary ($)(1) | | | Bonus ($) | | | All Other Compensation ($)(2) | | | Total ($) |
William A. Zartler Founder and Executive Chairman | | | 2020 | | | 381,808 | | | 250,000 | | | 7,266 | | | 639,074 |
Amanda M. Brock President and Chief Executive Officer | | | 2020 | | | 328,173 | | | 255,000 | | | 11,400 | | | 594,573 |
Chris B. Work Former Chief Financial Officer | | | 2020 | | | 271,060 | | | — | | | 136,837 | | | 407,897 |
(1) | We typically have 26 payroll periods in each calendar year; however salary amounts for 2020 include one additional payroll period resulting in numbers that slightly exceed the executive’s annual base salary for the year. |
(2) | Amounts in this column represent: (i) matching contributions under the Company’s 401(k) plan during the 2020 Fiscal Year for each NEO, and (ii) a $100,000 severance payment and $25,437 in accrued but unused paid time off that were paid to Mr. Work in connection with his November 2020 departure. |
| | | Option Awards(1) | |||||||||||||
Name | | | Number of Securities Underlying Unexercised Options (#) Exercisable(2) | | | Number of Securities Underlying Unexercised Options (#) Unexercisable(3) | | | Equity Incentive Plan Awards: Number of Securities Underlying Unexercised Unearned Options (#)(4) | | | Option Exercise Price(5) | | | Option Expiration Date(4) |
William A. Zartler | | | 138,000 | | | — | | | 92,000 | | | N/A | | | N/A |
Amanda M. Brock | | | 68,000 | | | 16,000 | | | 56,000 | | | N/A | | | N/A |
Chris B. Work | | | 108,000 | | | — | | | — | | | N/A | | | N/A |
(1) | Although the Profits Units do not require the payment of an exercise price, they are most economically similar to stock options, and as such, they are more properly classified as “options” under the definition provided in Item 402 of Regulation S-K as an instrument with an “option-like feature.” |
(2) | Amounts in this column represent vested Profits Units. Unlike an option, these are not “exercisable” at the holder’s election, but rather entitle to holder to participate in certain distributions as described under “Narrative Disclosure to Summary Compensation Table—Profits Units” above. |
(3) | Amounts in this column represent unvested Profits Units, which will vest as to one-half on March 7, 2021 and one-half on March 7, 2022, subject to the NEO’s continued employment through each vesting date. |
(4) | Amounts in this column represent unvested Profits Units, which will vest only upon the occurrence of a monetization event, subject to the NEO’s continued employment through such event. The consummation of this offering will be a monetization event for these purposes. |
(5) | The Profits Units are not traditional options, and therefore, there is no exercise price or expiration date associated with them. |
• | “Cause” generally means (a) commission of an act of fraud, theft or embezzlement or being convicted of, or pleading guilty or nolo contendere to, any felony that (as to any such felony) would reasonably be expected to result in damage or injury to the Company or its affiliates, or to the reputation of any such party; (b) commission of an act constituting gross negligence or willful misconduct that is materially harmful to the Company or its affiliates; (c) engaging in any action that is a violation of a material covenant or agreement of the grantee in favor of the Company or its affiliates that, if curable, is not cured within 15 days of receipt by the grantee of written notice of such violation, (d) material breach of any material covenant or agreement of the grantee under any confidentiality, noncompetition, non-disparagement, non-solicitation or similar agreement, including the provisions contained in the Profits Unit grant agreement; (e) engaging in habitual drug or alcohol abuse; or (f) failure or refusal to use good faith efforts to follow the reasonable directions of his or her supervisor; and |
• | “good reason” generally means (a) a material reduction in status, title, position or responsibilities without the agreement of the grantee; (b) a material reduction in annual base salary or failure to pay salary amounts; (c) a material breach by the Company of an agreement with the grantee; or the relocation of the grantee’s principal offices by more than 50 miles, and is subject to a notice and cure period. |
Annual retainer for Board membership | | | $ 30,000 |
Annual retainer for Lead Independent Director | | | $ 10,000 |
Additional annual retainers | | | |
• Chair of the Audit Committee | | | $ 65,000 |
• Chair of the Compensation Committee | | | $ 20,000 |
• Chair of the Nominating and Corporate Governance Committee | | | $ 10,000 |
• Member of the Audit Committee (other than Chair) | | | $ 40,000 |
• | the Existing Owners will own approximately 9.1% of the Class A common stock and all of the Class B common stock, representing 67.0% of our capital stock of which, (i) ConocoPhillips will own approximately 28.9% of our Class B common stock and an approximate 18.4% interest in Solaris LLC (representing approximately 18.4% of our combined economic interest and voting power), (ii) Trilantic will own approximately 9.1% of our Class A common stock, 22.7% of our Class B common stock and an approximate 14.5% interest in Solaris LLC (representing approximately 17.8% of our combined economic interest and voting power) and (iii) Yorktown will own approximately 22.5% of our Class B common stock and an approximate 14.3% interest in Solaris LLC (representing approximately 14.3% of our combined economic interest and voting power); |
• | Aris Inc. will own an approximate 36.3% interest in Solaris LLC; and |
• | the Existing Owners will own an approximate 63.7% interest in Solaris LLC. |
• | the Existing Owners will own approximately 7.5% of the Class A common stock and all of the Class B common stock, representing 59.0% of our capital stock (of which, (i) ConocoPhillips will own approximately 28.8% of our Class B common stock and an approximate 17.0% interest in Solaris LLC (representing approximately 17.0% of our combined economic interest and voting power), (ii) Trilantic will own approximately 7.5% of our Class A common stock, 22.7% of our Class B common stock and |
• | Aris Inc. will own an approximate 41.0% interest in Solaris LLC; and |
• | the Existing Owners will own an approximate 59.0% interest in Solaris LLC. |
(Dollars in thousands) | | | Six Months Ended June 30, 2021 | | | Year Ended December 31, 2020 |
Produced Water Handling | | | $38,849 | | | $50,915 |
Water Solutions | | | 12,805 | | | 15,011 |
Total | | | $51,654 | | | $65,926 |
• | any person who is, or at any time during the applicable period was, one of our executive officers or one of our directors; |
• | any person who is known by us to be the beneficial owner of more than 5.0% of our Class A common stock; |
• | any immediate family member of any of the foregoing persons, which means any child, stepchild, parent, stepparent, spouse, sibling, mother-in-law, father-in-law, son-in-law, daughter-in-law, brother-in-law or sister-in-law of a director, executive officer or a beneficial owner of more than 5.0% of our Class A common stock, and any person (other than a tenant or employee) sharing the household of such director, executive officer or beneficial owner of more than 5.0% of our Class A common stock; and |
• | any firm, corporation or other entity in which any of the foregoing persons is a partner or principal or in a similar position or in which such person has a 10.0% or greater beneficial ownership interest. |
• | each person known to us to beneficially own more than 5% of the outstanding shares of our Class A common stock or our Class B common stock; |
• | each of our named executive officers, directors and director nominees; and |
• | all of our executive officers and directors as a group. |
| | | Shares Beneficially Owned After the Offering if Underwriters’ Option is Not Exercised(1)(2) | | | Shares Beneficially Owned After the Offering if Underwriters’ Option is Exercised in Full(1)(2) | |||||||||||||
Name or Beneficial Owner | | | Class A Common Stock Owned Number | | | Class B Common Stock Owned Number | | | Total Voting Power(3) % | | | Class A Common Stock Owned Number | | | Class B Common Stock Owned Number | | | Total Voting Power(3) % |
5% Stockholders: | | | | | | | | | | | | | ||||||
COG Operating LLC(4) | | | — | | | 9,848,791 | | | 18.4% | | | — | | | 9,105,801 | | | 17.0% |
Entities associated with Trilantic Capital Management L.P.(5) | | | 1,771,656 | | | 7,735,435 | | | 17.8% | | | 1,638,003 | | | 7,151,876 | | | 16.4% |
Yorktown Energy Partners XI, L.P.(6) | | | — | | | 7,658,943 | | | 14.3% | | | — | | | 7,081,155 | | | 13.2% |
Entities associated with HBC Investments(7) | | | — | | | 2,368,000 | | | 4.4% | | | — | | | 2,189,359 | | | 4.1% |
Solaris Midstream Investment, LLC(8) | | | — | | | 3,884,581 | | | 7.3% | | | — | | | 3,648,544 | | | 6.8% |
Named Executive Officers, Directors and Director Nominees: | | | | | | | | | | | | | ||||||
William A. Zartler(9) | | | — | | | 1,897,244 | | | 3.5% | | | — | | | 1,797,890 | | | 3.4% |
Amanda M. Brock(9) | | | — | | | 573,918 | | | 1.1% | | | — | | | 543,863 | | | 1.0% |
Brenda R. Schroer | | | — | | | — | | | — | | | — | | | — | | | — |
Joseph Colonnetta | | | — | | | — | | | — | | | — | | | — | | | — |
Debra G. Coy | | | — | | | — | | | — | | | — | | | — | | | — |
W. Howard Keenan, Jr. | | | — | | | — | | | — | | | — | | | — | | | — |
Christopher Manning | | | — | | | — | | | — | | | — | | | — | | | — |
Andrew O’Brien | | | — | | | — | | | — | | | — | | | — | | | — |
Donald C. Templin | | | — | | | — | | | — | | | — | | | — | | | — |
M. Max Yzaguirre | | | — | | | — | | | — | | | — | | | — | | | — |
All executive officers, directors and director nominees as a group (10 persons)(10) | | | — | | | 2,471,162 | | | 4.6% | | | — | | | 2,341,753 | | | 4.4% |
(1) | Subject to the terms of the Solaris LLC Agreement, each Existing Owner will, subject to certain limitations, have the right to cause Solaris LLC to acquire all or a portion of its Solaris LLC Units for shares of our Class A common stock at a redemption ratio of one share of Class A common stock for each Solaris LLC Unit redeemed. In connection with such acquisition, the corresponding number of shares of Class B common stock will be cancelled. See “Certain Relationships and Related Person Transactions—Solaris LLC Agreement.” Pursuant to Rule 13d-3 under the Exchange Act, a person has beneficial ownership of a security as to which that person, directly or indirectly, through any contract, arrangement, understanding, relationship, or otherwise has or shares voting power and/or |
(2) | The number of shares to be issued to the beneficial holders is based on an implied equity value of Solaris LLC immediately prior to this offering, based on a price per share equal to the midpoint of the range set forth on the cover of this prospectus. The actual number of shares received by the beneficial holders will be determined after the closing of this offering pursuant to the terms of the Solaris LLC Agreement. Any increase or decrease (as applicable) in the number of shares of common stock to be received by the beneficial holders will result in a corresponding increase or decrease in the number of shares of common stock to be received by the other Existing Owners, but will not affect the aggregate number of shares of common stock held by the Existing Owners. |
(3) | Represents percentage of voting power of our Class A common stock and Class B common stock voting together as a single class. The Existing Owners will hold one share of Class B common stock for each Solaris LLC Unit that they own. Each share of Class B common stock has no economic rights, but entitles the holder thereof to one vote for each Solaris LLC Unit held by such holder. Accordingly, the Existing Owners collectively have a number of votes in Aris Inc. equal to the number of Solaris LLC Units that they hold. See “Corporation Reorganization,” “Description of Capital Stock—Class A Common Stock” and “—Class B Common Stock.” |
(4) | COG Operating LLC is a wholly owned subsidiary of ConocoPhillips. The address for COG Operating LLC is One Concho Center, 600 W. Illinois Avenue, Midland, Texas 79701. |
(5) | Represents shares beneficially owned by Trilantic Capital Partners Associates MGP V LLC (“TCP MGP V”). TCP MGP V is the sole general partner of Trilantic Capital Partners Associates V L.P. (“TCPAV”) and Trilantic Energy Partners Associates L.P. (“TEPA”). TCPAV is the sole general partner of Trilantic Capital Partners V (North America) L.P. (“Trilantic Fund V”), and TEPA is the sole general partner of Trilantic Energy Partners (North America) L.P. (“Trilantic Energy Partners”). Trilantic Capital Management L.P. (“TCM”) is the investment adviser of Trilantic Fund V and Trilantic Energy Partners. TCM, TCPAV, TEPA, as well as Charles Ayres, E. Daniel James and Christopher R. Manning (collectively, the “Trilantic Partners”) in their capacity as partners, members of the Board of Managers of TCP MGP V and Board of Directors of TCM, and majority owners of TCM, may be deemed to share voting and dispositive power of the voting interests in the shares beneficially owned by TCP MGP V. TCM, TCPAV, TEPA and the Trilantic Partners disclaim beneficial ownership of all shares beneficially owned by TCP MGP V. The address of each of the foregoing entities and individuals is c/o Trilantic Capital Management L.P., 399 Park Avenue, 39th Floor, New York, NY 10022. |
(6) | Yorktown XI Company LP is the sole general partner of Yorktown Energy Partners XI, L.P. Yorktown XI Associates LLC is the sole general partner of Yorktown XI Company LP. As a result, Yorktown XI Associates LLC may be deemed to share the power to vote or direct the vote or to dispose or direct the disposition of the securities owned by Yorktown Energy Partners XI, L.P. Yorktown XI Company LP and Yorktown XI Associates LLC disclaim beneficial ownership of the securities held by Yorktown Energy Partners XI, L.P. in excess of their pecuniary interest therein. W. Howard Keenan, Jr. is a a manager of Yorktown XI Associates LLC. Mr. Keenan disclaims beneficial ownership of the securities held by Yorktown Energy Partners XI, L.P. The address for Yorktown Energy Partners XI, L.P. is 410 Park Avenue, 20th Floor, New York, New York 10022. |
(7) | HBC Water Resources GP LP is the general partner of HBC Water Resources LP and HBC Water Resources II GP LP is the general partner of HBC Water Resources II LP. J. Hale Hoak and Joseph Colonnetta are the managers of the general partner of HBC Water Resources LP. J. Hale Hoak and Joseph Colonnetta are the managers of the general partner of HBC Water Resources II LP. As a result, J. Hale Hoak and Joseph Colonnetta have the power to vote and dispose of the securities held by each of HBC Water Resources LP and HBC Water Resources II LP. The address for HBC Water Resources LP and HBC Water Resources II LP is Reagan Place at Old Parkland, 3963 Maple Avenue, Suite 450, Dallas, Texas 75219. |
(8) | The ownership interests of William A. Zartler, Amanda M. Brock and certain of our other employees are represented, directly or indirectly, by limited liability company interests in Solaris Investment. Each member of Solaris Investment will participate in this offering pro rata, except Mr. Zartler and Ms. Brock will only participate to the extent the underwriters’ option to purchase additional shares is exercised in full or in part. Solaris Investment is managed by a board of directors and William A. Zartler is the sole director. As a result, Mr. Zartler has the power to vote and dispose of the securities held by Solaris Investment. Mr. Zartler disclaims beneficial ownership of the securities held by Solaris Investment in excess of his pecuniary interests therein. |
(9) | Following the completion of this offering, Solaris Investment has advised us that it intends to make a pro rata distribution of all of the Solaris LLC Units and shares of our Class B common stock it receives in connection with our corporate reorganization on a pro rata basis to its members. In connection with such distribution, it is anticipated that Solaris Energy Capital, LLC, a company controlled by Mr. Zartler, will receive 1,897,244 shares of Class B common stock (or 1,797,890 shares if the underwriters exercise their option to purchase additional shares in full) and Ms. Brock will receive 573,918 shares of Class B common stock (or 543,863 shares if the underwriters exercise their option to purchase additional shares in full). Because such individuals expect to receive the Class B shares within 60 days of the closing of this offering, these shares have been included in the table. |
(10) | Does not include restricted stock units or other awards that may be granted to certain of our executive officers and directors after the closing of this offering, the terms of which have not been decided. See “Executive Compensation—2021 Equity Incentive Plan” and “Executive Compensation—Director Compensation.” |
• | the transaction is approved by the Board before the date the interested stockholder attained that status; |
• | upon consummation of the transaction that resulted in the stockholder becoming an interested stockholder, the interested stockholder owned at least 85% of the voting stock of the corporation outstanding at the time the transaction commenced; or |
• | on or after such time the business combination is approved by the Board and authorized at a meeting of stockholders by at least two-thirds of the outstanding voting stock that is not owned by the interested stockholder. |
• | establish advance notice procedures with regard to stockholder proposals relating to the nomination of candidates for election as directors or new business to be brought before meetings of our stockholders. These procedures provide that notice of stockholder proposals must be timely given in writing to our corporate secretary prior to the meeting at which the action is to be taken. Generally, to be timely, notice must be received at our principal executive offices not less than 90 days nor more than 120 days prior to the first anniversary date of the annual meeting for the preceding year. Our amended and restated bylaws specify the requirements as to form and content of all stockholders’ notices. These requirements may preclude stockholders from bringing matters before the stockholders at an annual or special meeting; |
• | provide our Board the ability to authorize undesignated preferred stock. This ability makes it possible for our Board to issue, without stockholder approval, preferred stock with voting or other rights or preferences that could impede the success of any attempt to change control of us. These and other provisions may have the effect of deferring hostile takeovers or delaying changes in control or management of our company; |
• | provide that the authorized number of directors may be changed only by resolution of the Board; |
• | provide that all vacancies, including newly created directorships, shall, except as otherwise required by law or, if applicable, the rights of holders of a series of preferred stock, only be filled by the affirmative vote of a majority of directors then in office, even if less than a quorum; |
• | provide that any action required or permitted to be taken by the stockholders must be effected at a duly called annual or special meeting of stockholders and may not be effected by any consent in writing in lieu of a meeting of such stockholders, subject to the rights of the holders of any series of preferred stock with respect to such series; |
• | provide that certain provisions of our amended and restated certificate of incorporation and amended and restated bylaws may be amended by the affirmative vote of the holders of at least two-thirds of our then outstanding common stock entitled to vote thereon, voting together as a single class; |
• | provide that special meetings of our stockholders may only be called by our Board pursuant to a resolution adopted by the affirmative vote of a majority of the total number of authorized directors whether or not there exist any vacancies in previously authorized directorships; |
• | provide for our Board to be divided into three classes of directors, with each class as nearly equal in number as possible, serving staggered three year terms, other than directors which may be elected by holders of preferred stock, if any. This system of electing and removing directors may tend to discourage a third party from making a tender offer or otherwise attempting to obtain control of us, because it generally makes it more difficult for stockholders to replace a majority of the directors; |
• | provide that the affirmative vote of the holders of at least 66-2/3% of the voting power of all then outstanding common stock entitled to vote generally in the election of directors, voting together as a single class, shall be required to remove any or all of the directors from office and such removal may only be for cause; and |
• | provide that our amended and restated bylaws can be amended by the Board. |
• | the Designated Parties have the right to, and have no duty to abstain from, exercising such right to, conduct business with any business that is competitive or in the same line of business as us, do business with any of our clients or customers, or invest or own any interest publicly or privately in, or develop a business relationship with, any business that is competitive or in the same line of business as us; |
• | if the Designated Parties acquire knowledge of a potential transaction that could be a corporate opportunity, they have no duty to offer such corporate opportunity to us; and |
• | we have renounced any interest or expectancy in, or in being offered an opportunity to participate in, such corporate opportunities. |
• | for any breach of their duty of loyalty to us or our stockholders; |
• | for acts or omissions not in good faith or which involve intentional misconduct or a knowing violation of law; |
• | for unlawful payment of dividend or unlawful stock repurchase or redemption, as provided under Section 174 of the DGCL; or |
• | for any transaction from which the director derived an improper personal benefit. |
• | an individual who is a citizen or resident of the United States; |
• | a corporation created or organized in or under the laws of the United States or any State thereof (including the District of Columbia); |
• | an estate, the income of which is subject to U.S. federal income taxation regardless of its source; or |
• | a trust, the administration of which is subject to the primary supervision of a court within the United States and for which one or more U.S. persons have the authority to control all substantial decisions, or that has a valid election in effect under applicable U.S. Treasury Regulations to be treated as a U.S. person. |
Underwriter | | | Number of Shares |
Goldman Sachs & Co. LLC | | | |
Citigroup Global Markets Inc. | | | |
J.P. Morgan Securities LLC | | | |
Wells Fargo Securities, LLC | | | |
Barclays Capital Inc. | | | |
Evercore Group L.L.C. | | | |
Capital One Securities, Inc. | | | |
Johnson Rice & Company L.L.C. | | | |
Raymond James & Associates, Inc. | | | |
Stifel, Nicolaus & Company, Incorporated | | | |
USCA Securities LLC | | | |
Total | | | 17,650,000 |
| | | Per Share | | | Total | |||||||
| | | Without Option | | | With Option | | | Without Option | | | With Option | |
Underwriting discounts and commissions paid by us | | | $ | | | $ | | | $ | | | $ |
Proceeds, before expenses, to us | | | $ | | | $ | | | $ | | | $ |
• | Stabilizing transactions permit bids to purchase the underlying security so long as the stabilizing bids do not exceed a specified maximum. |
• | Over-allotment involves sales by the underwriters of shares in excess of the number of shares the underwriters are obligated to purchase, which creates a syndicate short position. The short position may be either a covered short position or a naked short position. In a covered short position, the number of shares over-allotted by the underwriters is not greater than the number of shares that they may purchase in their option to purchase additional shares. In a naked short position, the number of shares involved is greater than the number of shares in their option to purchase additional shares. The underwriters may close out any covered short position by either exercising their option to purchase additional shares and/or purchasing shares in the open market. |
• | Syndicate covering transactions involve purchases of the Class A common stock in the open market after the distribution has been completed in order to cover syndicate short positions. In determining the source of shares to close out the short position, the underwriters will consider, among other things, the price of shares available for purchase in the open market as compared to the price at which they may purchase shares through the option to purchase additional shares. If the underwriters sell more shares than could be covered |
• | Penalty bids permit the representatives to reclaim a selling concession from a syndicate member when the Class A common stock originally sold by the syndicate member is purchased in a stabilizing or syndicate covering transaction to cover syndicate short positions. |
• | In passive market making, market makers in the Class A common stock who are underwriters or prospective underwriters may, subject to limitations, make bids for or purchases of our Class A common stock until the time, if any, at which a stabilizing bid is made. |
(a) | to any legal entity which is a qualified investor as defined in the Prospectus Regulation; |
(b) | by the underwriters to fewer than 150 natural or legal persons (other than qualified investors as defined in the Prospectus Regulation), subject to obtaining the prior written consent of the representatives for any such offer; or |
(c) | in any other circumstances falling within Article 1(4) of the Prospectus Regulation, |
(a) | to any legal entity which is a qualified investor as defined under Article 2 of the UK Prospectus Regulation; |
(b) | to fewer than 150 natural or legal persons (other than qualified investors as defined under Article 2 of the UK Prospectus Regulation), subject to obtaining the prior consent of the representatives for any such offer; or |
(c) | in any other circumstances falling within Section 86 of the FSMA, |
| | | Page | |
Aris Water Solutions, Inc. | | | |
Unaudited Pro Forma Condensed Consolidated Financial Statements | | | |
| | | ||
| | | ||
| | | ||
| | | ||
| | | ||
| | | ||
Solaris Midstream Holdings, LLC | | | |
Condensed Consolidated Financial Statements (Unaudited) | | | |
| | | ||
| | | ||
| | | ||
| | | ||
| | | ||
| | | ||
Annual Financial Statements | | | |
| | | ||
| | | ||
| | | ||
| | | ||
| | | ||
| | | ||
| | | ||
Aris Water Solutions, Inc. | | | |
| | | ||
| | | ||
| | |
• | the contemplated transactions described under “Corporate Reorganization” elsewhere in this prospectus; |
• | the initial public offering of shares of Class A common stock and the use of the net proceeds therefrom as described in “Use of Proceeds” (the “Offering”). The net proceeds from the sale of the Class A common stock to be retained by the Company are expected to be $43.9 million (based on an assumed initial offering price of $17.00 per share, the midpoint of the range set forth on the cover of this prospectus), resulting from gross proceeds of $300.1 million, reduced for of (i) underwriting discounts of approximately $18.0 million and other offering costs of $1.9 million and (ii) contribution to Solaris LLC of $236.3 million in exchange for the acquisition of the Solaris LLC Units to be held by the Company; |
• | a provision for corporate income taxes at an effective rate of 8% (which is derived from a total estimated rate of 23.5% for Solaris LLC, reduced by the estimated noncontrolling interest of 63.7%) for the year ended December 31, 2020 and the six months ended June 30, 2021, inclusive of all U.S. federal, state and local income taxes; and |
• | in connection with the offering, we will enter into a Tax Receivable Agreement with the TRA Holders which generally provides for a payment by us for 85% of net cash savings, if any, in U.S. federal, state and local income taxes that we realize. We have estimated this liability to be approximately $75.7 million. |
| | | Historical Solaris Midstream Holdings, LLC | | | Pro Forma Adjustments | | | | | Pro Forma Aris Water Solutions, Inc. | ||
Assets | | | | | | | | | ||||
Cash and Cash Equivalents | | | $31,123 | | | $40,650 | | | (a) | | | $71,773 |
Accounts Receivable, Net | | | 25,928 | | | — | | | | | 25,928 | |
Accounts Receivable from Affiliate | | | 18,346 | | | — | | | | | 18,346 | |
Other Receivables | | | 3,278 | | | — | | | | | 3,278 | |
Prepaids, Deposits and Other Current Assets | | | 2,149 | | | — | | | | | 2,149 | |
Total Current Assets | | | 80,824 | | | 40,650 | | | | | 121,474 | |
| | | | | | | | | |||||
Fixed Assets | | | | | | | | | ||||
Property, Plant and Equipment | | | 706,806 | | | — | | | | | 706,806 | |
Accumulated Depreciation | | | (56,826) | | | — | | | | | (56,826) | |
Total Property, Plant and Equipment, Net | | | 649,980 | | | — | | | | | 649,980 | |
Intangibles, Net | | | 321,233 | | | — | | | | | 321,233 | |
Goodwill | | | 34,585 | | | — | | | | | 34,585 | |
Deferred Tax Assets, Net | | | ― | | | 10,078 | | | (b) | | | 10,078 |
Other Assets | | | 2,140 | | | — | | | | | 2,140 | |
Total Assets | | | $ 1,088,762 | | | $50,728 | | | | | $1,139,490 | |
| | | | | | | | | |||||
Liabilities, Mezzanine Equity and Members' Equity | | | | | | | | | ||||
Accounts Payable | | | $10,414 | | | $— | | | | | $10,414 | |
Payables to Affiliate | | | 1,693 | | | — | | | | | 1,693 | |
Accrued and Other Current Liabilities | | | 37,259 | | | — | | | | | 37,259 | |
Total Current Liabilities | | | 49,366 | | | — | | | | | 49,366 | |
Asset Retirement Obligation | | | 5,629 | | | — | | | | | 5,629 | |
Long-Term Debt, Net of Debt Issuance Costs | | | 391,115 | | | — | | | | | 391,115 | |
Deferred Revenue Liability and Other Long-Term liabilities | | | 1,335 | | | — | | | | | 1,335 | |
Payable related to parties pursuant to tax receivable agreements | | | ― | | | 75,700 | | | (b) | | | 75,700 |
Total Liabilities | | | 447,445 | | | 75,700 | | | | | 523,145 | |
| | | | | | | | | |||||
Commitment and Contingencies | | | ― | | | — | | | | | — | |
| | | | | | | | | |||||
Members' Equity | | | 641,317 | | | (641,317) | | | (c) | | | — |
Shareholders' Equity: | | | | | — | | | | | — | ||
Class A common stock | | | ― | | | 194 | | | (c) | | | 194 |
Class B common stock | | | ― | | | — | | | (c) | | | — |
Additional Paid-In Capital | | | ― | | | 181,806 | | | (c)(d) | | | 181,806 |
Total Members’ Equity and Aris Inc.’s Share of Equity | | | 641,317 | | | (459,317) | | | | | 182,000 | |
Non-Controlling Interest | | | ― | | | 434,345 | | | (e) | | | 434,345 |
Total Liabilities and Stockholders' Equity | | | $ 1,088,762 | | | $50,728 | | | | | $1,139,490 |
| | | Historical Solaris Midstream Holdings, LLC | | | Pro Forma Adjustments | | | | | Pro Forma Aris Water Solutions, Inc. | ||
Statement of Operations Data | | | | | | | | | ||||
Revenue | | | | | | | | | ||||
Produced Water Handling | | | $85,810 | | | $— | | | | | $85,810 | |
Water Solutions | | | 16,963 | | | — | | | | | 16,963 | |
Total Revenue | | | 102,773 | | | — | | | | | 102,773 | |
| | | | | | | | | |||||
Cost of Revenues | | | | | | | | | ||||
Direct Operating Costs | | | 43,206 | | | | | | | 43,206 | ||
Depreciation, Amortization and Accretion | | | 30,172 | | | | | | | 30,172 | ||
Total Cost of Revenue | | | 73,378 | | | — | | | | | 73,378 | |
| | | | | | | | | |||||
Operating Costs and Expenses | | | | | | | | | ||||
General and Administrative | | | 10,012 | | | | | | | 10,012 | ||
Loss on Disposal of Asset, Net | | | 217 | | | | | | | 217 | ||
Transaction Costs | | | 77 | | | | | | | 77 | ||
Abandoned Projects | | | 1,356 | | | | | | | 1,356 | ||
Total Operating Expenses | | | 11,662 | | | — | | | | | 11,662 | |
Operating Income | | | 17,733 | | | — | | | | | 17,733 | |
| | | | | | | | | |||||
Other Expense | | | | | | | | | ||||
Interest Expense, Net | | | 9,975 | | | | | | | 9,975 | ||
Loss on Debt Modification | | | 380 | | | | | | | 380 | ||
Total Other Expense | | | 10,355 | | | — | | | | | 10,355 | |
Income Before Taxes | | | 7,378 | | | — | | | | | 7,378 | |
Income Taxes | | | 2 | | | 630 | | | (f) | | | 632 |
Net Income (Loss) | | | 7,376 | | | (630) | | | | | 6,746 | |
Accretion and Dividend—Redeemable Preferred Units | | | 21 | | | | | | | 21 | ||
Net Income (Loss) Attributable to Members'/Stockholders’ Equity | | | 7,397 | | | (630) | | | | | 6,767 | |
Less: Net Income Attributable to Noncontrolling Interest | | | | | 4,712 | | | (g) | | | 4,712 | |
Net Income (Loss) Attributable to Aris Water Solutions, Inc. | | | $7,397 | | | $(5,342) | | | | | 2,055 | |
| | | | | | | | | |||||
Net Income (Loss) Per Share Class A Common Stock (h) | | | | | | | | | ||||
Basic and Diluted | | | | | | | | | $0.11 | |||
| | | | | | | | | |||||
Weighted Average Shares Class A Common Stock Outstanding (h) | | | | | | | | | ||||
Basic and Diluted | | | | | | | | | 19,422 |
| | | Historical Solaris Midstream Holdings, LLC | | | Pro Forma Adjustments | | | | | Pro Forma Aris Water Solutions, Inc. | ||
Statement of Operations Data | | | | | | | | | ||||
Revenue | | | | | | | | | ||||
Produced Water Handling | | | $ 141,659 | | | $— | | | | | $141,659 | |
Water Solutions | | | 29,813 | | | — | | | | | 29,813 | |
Total Revenue | | | 171,472 | | | — | | | | | 171,472 | |
| | | | | | | | | |||||
Cost of Revenues | | | | | | | | | ||||
Direct Operating Costs | | | 95,431 | | | | | | | 95,431 | ||
Depreciation, Amortization and Accretion | | | 44,027 | | | | | | | 44,027 | ||
Total Cost of Revenue | | | 139,458 | | | — | | | | | 139,458 | |
| | | | | | | | | |||||
Operating Costs and Expenses | | | | | | | | | ||||
General and Administrative | | | 18,663 | | | | | | | 18,663 | ||
Loss on Disposal of Asset, Net | | | 133 | | | | | | | 133 | ||
Transaction Costs | | | 3,389 | | | | | | | 3,389 | ||
Abandoned Projects | | | 2,125 | | | | | | | 2,125 | ||
Total Operating Expenses | | | 24,310 | | | | | | | 24,310 | ||
Operating Income | | | 7,704 | | | | | | | 7,704 | ||
| | | | | | | | | |||||
Other Expense | | | | | | | | | ||||
Interest Expense, Net | | | 7,674 | | | | | | | 7,674 | ||
Loss on Debt Modification | | | — | | | | | | | — | ||
Total Other Expense | | | 7,674 | | | — | | | | | 7,674 | |
Income Before Taxes | | | 30 | | | | | | | 30 | ||
Income Taxes | | | 23 | | | 3 | | | (f) | | | 26 |
Net Income (Loss) | | | 7 | | | (3) | | | | | $4 | |
Less: Accretion and Dividend—Redeemable Preferred Units | | | (4,335) | | | | | | | (4,335) | ||
Net Income Attributable to Members'/Stockholders’ Equity | | | $(4,328) | | | $(3) | | | | | $(4,331) | |
Less: Net Loss Attributable to Non-Controlling Interest | | | | | (2,759) | | | (g) | | | (2,759) | |
Net Income (Loss) Aris Water Solutions, Inc. | | | $(4,328) | | | $2,756 | | | | | $(1,572) | |
| | | | | | | | | |||||
Net Income (Loss) Per Share Class A Common Stock (i) | | | | | | | | | ||||
Basic and Diluted | | | | | | | | | $(0.08) | |||
| | | | | | | | | |||||
Weighted Average Class A Common Stock Outstanding (i) | | | | | | | | | ||||
Basic and Diluted | | | | | | | | | 19,422 |
i. | Net proceeds from the offering and use of proceeds as follows: |
Gross Proceeds from Offering | | | $300,050 |
Less: | | | |
Underwriting Discounts and Commissions | | | (18,000) |
Issuance Expenses | | | (1,900) |
Proceeds, Net of Underwriting and Issuance Expenses | | | 280,150 |
Less: | | | |
Distribution in Exchange for Solaris LLC Units Being Sold by Existing Owners | | | (236,250) |
Retained Proceeds from the Offering | | | $43,900 |
ii. | Transaction bonus of $3.25 million to officers and employees in connection with the IPO paid out of cash on hand. |
(b) | Reflects adjustments to give effect to tax adjustments associated with the Corporate Reorganization and adjustments to give effect to the Tax Receivable Agreement (as described in “Certain Relationships and Related Party Transactions—Tax Receivable Agreement”) based on the following assumptions: |
i. | We expect to record $9.8 million in deferred tax assets for the estimated income tax effects of the differences in the tax basis and the books basis of the assets owned by Solaris Inc. following completion of the Corporate Reorganization (for purposes of these pro forma statements, we have also increased the deferred tax asset balance by $0.3 million to reflect the expected tax benefit associated with the transaction bonus described above); and |
ii. | In connection with the offering, we will enter into a Tax Receivable Agreement with the TRA Holders which generally provides for a payment by us for 85% of net cash savings, if any, in U.S. federal, state and local income taxes that we realize. We have estimated this liability to be approximately $75.7 million. This estimate assumes 16,477,538 Solaris LLC Units will be redeemed by the existing owners, comprised of 14,705,882 units sold plus 1,771,656 units exchanged for shares of Class A common stock for tax planning purposes. The estimated Tax Receivable Agreement liability also includes significant assumptions including (i) all exchanges occurred on June 30, 2021; (ii) a price of $17.00 per share (the midpoint of the price range set forth on the cover page of this prospectus); (iii) a constant combined federal and state corporate tax rate of 23.5%; (iv) sufficient future taxable income to fully utilize the tax benefits in the year the related tax deduction arises; and (v) no material changes in tax law. |
(c) | Represents an adjustment to members’/stockholders’ equity reflecting: |
i. | Par value of $0.01 for approximately 19.4 million shares of Class A common stock to be outstanding following this offering, and |
ii. | A decrease of $434.3 million in members’ equity to allocate a portion of Aris Water Solutions, Inc.’s equity to the noncontrolling interest. (See Note (e) below). |
(d) | Represents the effect of the following:i. |
The issuance of shares of Class A common stock in this Offering and the application of the net | proceeds therefrom, |
ii. | The net impact of the recording of deferred tax assets and the payable related to the Corporate Reorganization and the Tax Receivable Agreement, as described under note (b) above, |
iii. | The estimated impact of $21.3 million for the historical book basis for existing LLC unit holders that have converted to Class A shares of Aris Water Solutions, Inc. for tax planning purposes, and |
iv. | The transaction bonus of $3.25 million to officers and employees in connection with the IPO. |
(e) | Represents non-controlling interest due to consolidation of financial results of Solaris LLC. As described in “Corporate Reorganization,” Aris water Solutions, Inc. will become the sole managing member of Solaris LLC. Aris Water Solutions, Inc. will initially have a minority economic interest in Solaris LLC, but will have control over the management of Solaris LLC. As a result, we will consolidate the financial results of Solaris LLC and will report a noncontrolling interest on our consolidated balance sheet for the percentage of Solaris LLC Units not held by Aris Water Solutions, Inc. Upon completion of the contemplated transactions, the noncontrolling interest is expected to own approximately 63.7% of Solaris LLC. Details for the adjustment for the noncontrolling interest are as follows: |
Historical Solaris Midstream Members' Equity as of June 30, 2021 | | | $641,317 |
Gross Proceeds from Offering | | | 300,050 |
Underwriting Discounts and Offering Costs | | | (19,900) |
Net Distribution to Existing LLC Unit Holders | | | (236,250) |
Transaction Bonus | | | (3,250) |
Pro Forma Solaris Midstream Member's Equity as of June 30, 2021 | | | $681,967 |
Estimated Noncontrolling Interest Percentage of Aris Water Solutions, Inc. | | | 63.7% |
Pro Forma Noncontrolling Interest of Aris Water Solutions, Inc. | | | $434,345 |
(f) | Reflects estimated incremental income tax expense of $0.6 million for the six months ended June 30, 2021 and $3 thousand for the year ended December 31, 2020 associated with the Company’s historical results of operations assuming the Company’s earnings had been subject to federal income tax as a subchapter C corporation using a statutory tax rate of approximately 23.5% and based on the Company’s ownership of approximately 36% of Solaris LLC following completion of the contemplated transactions. This rate is inclusive of U.S. federal and state income taxes. |
(g) | Reflects the reduction in consolidated net income attributable to non-controlling interest for Solaris LLC’s historical results of operations. Upon completion of the Corporate Reorganization, the non-controlling interest will be approximately 64%. |
(h) | On a pro forma basis, basic earnings per share and diluted earnings per share are the same as there were no antidilutive securities during the periods presented. Earnings per share on a pro forma basis is computed as follows: |
| | | Six Months Ended June 30, 2021 | | | Year Ended December 31, 2020 | |
Pro forma income before income taxes | | | $7,378 | | | $30 |
Pro forma income tax expense | | | (632) | | | (26) |
Pro forma net income | | | 6,746 | | | 4 |
Equity accretion and dividend related to redeemable preferred units | | | 21 | | | (4,335) |
Pro forma net income (loss) attributable to members'/stockholders’ equity | | | 6,767 | | | (4,331) |
Net income (loss) attributable to noncontrolling interests | | | (4,712) | | | 2,759 |
Pro forma income (loss) available to Class A common stock | | | $2,055 | | | $(1,572) |
Weighted average shares of Class A common stock outstanding (1)(2) | | | 19,422 | | | 19,422 |
Pro forma net income (loss) available to Class A common stock per share(1)(2) | | | $0.11 | | | $(0.08) |
(1) | Pro forma weighted average share amounts for the periods presented have not been adjusted for the potential impacts of 632,353 shares of Class A common stock underlying restricted stock units or other awards that may be granted to certain employees and non-employee directors after the closing of this offering as the terms have not been determined. For this purpose, we have assumed (1) the restricted stock units or other awards will be restricted only due to time-based vesting and (2) the restricted stock units or other awards will qualify as a participating security, but will not have a contractual obligation to share in the losses of the Company. Under the two-class method for the six months ended June 30, 2021, pro forma income (loss) available to Class A common stock would have been reduced by approximately 3% or $62 thousand, which would have reduced basic and diluted pro forma net income per share to $0.10. There would be no impact to the year ended December 31, 2020, for the participating units since the Company was in a loss position. There would be no impact to basic or diluted shares outstanding. |
(2) | Pro forma diluted weighted average share amounts for the periods presented exclude the 34,078,344 shares of Class A common stock reserved for issuance upon exchange of the 34,078,344 Solaris LLC Units as the impact would be antidilutive. Net income would be reduced, and net loss would be increased by $1.1 million and $5 thousand for the six months ended June 30, 2021 and the year ended December 31, 2020, respectively, due to an increase in tax expense. Inclusion of earnings attributable to the noncontrolling interest and the incremental shares to be issued on conversion would be antidilutive to earnings (loss) per share. |
| | | June 30, 2021 | | | December 31, 2020 | |
Assets | | | | | ||
Cash and Cash Equivalents | | | $31,123 | | | $24,932 |
Accounts Receivable, Net | | | 25,928 | | | 21,561 |
Accounts Receivable from Affiliate | | | 18,346 | | | 11,538 |
Other Receivables | | | 3,278 | | | 3,722 |
Prepaids, Deposits and Other Current Assets | | | 2,149 | | | 4,315 |
Total Current Assets | | | 80,824 | | | 66,068 |
| | | | | |||
Fixed Assets | | | | | ||
Property, Plant and Equipment | | | 706,806 | | | 661,446 |
Accumulated Depreciation | | | (56,826) | | | (43,258) |
Total Property, Plant and Equipment, Net | | | 649,980 | | | 618,188 |
Intangibles, Net | | | 321,233 | | | 337,535 |
Goodwill | | | 34,585 | | | 34,585 |
Other Assets | | | 2,140 | | | 1,429 |
Total Assets | | | $1,088,762 | | | $1,057,805 |
| | | | | |||
Liabilities, Mezzanine Equity and Members' Equity | | | | | ||
Accounts Payable | | | $10,414 | | | $16,067 |
Payables to Affiliate | | | 1,693 | | | 1,884 |
Accrued and Other Current Liabilities | | | 37,259 | | | 27,838 |
Total Current Liabilities | | | 49,366 | | | 45,789 |
Asset Retirement Obligation | | | 5,629 | | | 5,291 |
Long-Term Debt, Net of Debt Issuance Costs | | | 391,115 | | | 297,000 |
Deferred Revenue Liability and Other Long-Term liabilities | | | 1,335 | | | 1,432 |
Total Liabilities | | | 447,445 | | | 349,512 |
Commitment and Contingencies (Note 10) | | | | | ||
Mezzanine Equity: | | | | | ||
Redeemable Preferred Units, $10,000.00 par value, none issued or outstanding as of June 30, 2021 and 7,500 issued and 7,307 outstanding as of December 31, 2020 | | | — | | | 74,378 |
Members' Equity | | | | | ||
Class A units, $10.00 par value, 27,797,658 issued and outstanding as of June 30, 2021 and 27,797,207 issued and outstanding as of December 31, 2020 | | | 323,809 | | | 318,394 |
Class B units, $10.00 par value, 3,556,051 issued and outstanding as of June 30, 2021 and as of December 31, 2020 | | | 37,715 | | | 37,023 |
Class C units, $0.00 par value, 878,850 issued and outstanding as of June 30, 2021 and 806,350 issued and outstanding as of December 31, 2020 | | | — | | | — |
Class D units, $10.00 par value, 6,651,100 issued and outstanding as of June 30, 2021 and as of December 31, 2020 | | | 279,793 | | | 278,498 |
Total Members' Equity | | | 641,317 | | | 633,915 |
Total Liabilities, Mezzanine Equity and Members' Equity | | | $1,088,762 | | | $1,057,805 |
| | | Three Months Ended June 30, | | | Six Months Ended June 30, | |||||||
| | | 2021 | | | 2020 | | | 2021 | | | 2020 | |
Revenue | | | | | | | | | ||||
Produced Water Handling | | | $46,074 | | | $35,775 | | | $85,810 | | | $69,031 |
Water Solutions | | | 10,510 | | | 1,870 | | | 16,963 | | | 15,061 |
Total Revenue | | | 56,584 | | | 37,645 | | | 102,773 | | | 84,092 |
| | | | | | | | | |||||
Cost of Revenue | | | | | | | | | ||||
Direct Operating Costs | | | 22,452 | | | 20,163 | | | 43,206 | | | 49,433 |
Depreciation, Amortization and Accretion | | | 15,215 | | | 10,289 | | | 30,172 | | | 19,778 |
Total Cost of Revenue | | | 37,667 | | | 30,452 | | | 73,378 | | | 69,211 |
| | | | | | | | | |||||
Operating Expenses | | | | | | | | | ||||
General and administrative | | | 5,317 | | | 4,530 | | | 10,012 | | | 8,648 |
Loss on Disposal of Asset, Net | | | 173 | | | 67 | | | 217 | | | 67 |
Transaction Costs | | | 15 | | | 1,352 | | | 77 | | | 3,099 |
Abandoned Projects | | | 1,145 | | | 498 | | | 1,356 | | | 1,133 |
Total Operating Expenses | | | 6,650 | | | 6,447 | | | 11,662 | | | 12,947 |
Operating Income | | | 12,267 | | | 746 | | | 17,733 | | | 1,934 |
| | | | | | | | | |||||
Other Expense | | | | | | | | | ||||
Interest Expense, Net | | | 7,324 | | | 1,675 | | | 9,975 | | | 3,265 |
Loss on Debt Modification | | | 380 | | | — | | | 380 | | | — |
Total Other Expense | | | 7,704 | | | 1,675 | | | 10,355 | | | 3,265 |
Income (Loss) before Taxes | | | 4,563 | | | (929) | | | 7,378 | | | (1,331) |
Income Taxes | | | 2 | | | 2 | | | 2 | | | 6 |
Net Income (Loss) | | | $4,561 | | | $(931) | | | $7,376 | | | $(1,337) |
Equity Accretion and Dividend Related to Redeemable Preferred Units | | | 14 | | | (417) | | | 21 | | | (417) |
Net Income (Loss) Attributable to Members' Equity | | | $4,575 | | | $(1,348) | | | $7,397 | | | $(1,754) |
| | | Three and Six Months Ended June 30, 2021 | |||||||||||||||||||||||||
| | | Class A | | | Class B | | | Class C | | | Class D | | | Total Members’ Equity | |||||||||||||
| | | Units | | | Amount | | | Units | | | Amount | | | Units | | | Amount | | | Units | | | Amount | | |||
Balance at January 1, 2021 | | | 27,797 | | | $318,394 | | | 3,556 | | | $37,023 | | | 807 | | | $— | | | 6,651 | | | $278,498 | | | $633,915 |
Capital Contributions | | | 1 | | | 5 | | | — | | | — | | | — | | | — | | | — | | | — | | | 5 |
Issuance of Class C Units | | | — | | | — | | | — | | | — | | | 69 | | | — | | | — | | | — | | | — |
Equity Accretion and Dividend related to Redeemable Preferred Units | | | — | | | 5 | | | — | | | 1 | | | — | | | — | | | — | | | 1 | | | 7 |
Net Income | | | — | | | 2,059 | | | — | | | 263 | | | — | | | — | | | — | | | 493 | | | 2,815 |
Balance at March 31, 2021 | | | 27,798 | | | 320,463 | | | 3,556 | | | 37,287 | | | 876 | | | — | | | 6,651 | | | 278,992 | | | 636,742 |
Issuance of Class C Units | | | — | | | — | | | — | | | — | | | 3 | | | — | | | — | | | — | | | — |
Equity Accretion and Dividend related to Redeemable Preferred Units | | | — | | | 10 | | | — | | | 1 | | | — | | | — | | | — | | | 3 | | | 14 |
Net Income | | | — | | | 3,336 | | | — | | | 427 | | | — | | | — | | | — | | | 798 | | | 4,561 |
Balance at June 30, 2021 | | | 27,798 | | | $323,809 | | | 3,556 | | | $37,715 | | | 879 | | | $— | | | 6,651 | | | $279,793 | | | $641,317 |
| | | Three and Six Months Ended June 30, 2020 | |||||||||||||||||||||||||
| | | Class A | | | Class B | | | Class C | | | Class D | | | Total Members’ Equity | |||||||||||||
| | | Units | | | Amount | | | Units | | | Amount | | | Units | | | Amount | | | Units | | | Amount | | |||
Balance at January 1, 2020 | | | 22,104 | | | $232,945 | | | 3,440 | | | $36,296 | | | 833 | | | $— | | | 6,386 | | | $276,267 | | | $545,508 |
Forfeiture of Class C Units | | | — | | | — | | | — | | | — | | | (26) | | | — | | | — | | | — | | | — |
Net Loss | | | — | | | (281) | | | — | | | (44) | | | — | | | — | | | — | | | (81) | | | (406) |
Balance at March 31, 2020 | | | 22,104 | | | 232,664 | | | 3,440 | | | 36,252 | | | 807 | | | — | | | 6,386 | | | 276,186 | | | 545,102 |
Issuance of Class A Units as consideration for the asset acquisition of Concho's Lea County, New Mexico produced water gathering, transportation and disposal assets | | | 4,561 | | | 77,602 | | | — | | | — | | | — | | | — | | | — | | | — | | | 77,602 |
Forfeiture of Class C Units | | | — | | | — | | | — | | | — | | | (1) | | | — | | | — | | | — | | | — |
Equity Accretion and Dividend related to Redeemable Preferred Units | | | — | | | (305) | | | — | | | (39) | | | — | | | — | | | — | | | (73) | | | (417) |
Net Loss | | | — | | | (680) | | | — | | | (88) | | | — | | | — | | | — | | | (163) | | | (931) |
Balance at June 30, 2020 | | | 26,665 | | | $309,281 | | | 3,440 | | | $36,125 | | | 806 | | | $— | | | 6,386 | | | $275,950 | | | $621,356 |
| | | Six Months Ended June 30, | ||||
| | | 2021 | | | 2020 | |
Cash Flow from Operating Activities | | | | | ||
Net Income (Loss) | | | $7,376 | | | $(1,337) |
Adjustments to reconcile Net Income (Loss) to Net Cash provided by Operating Activities | | | | | ||
Depreciation, Amortization and Accretion | | | 30,172 | | | 19,778 |
Amortization of Deferred Financing Costs | | | 763 | | | 362 |
Loss on Debt Modification | | | 380 | | | — |
Loss on Disposal of Asset, Net | | | 217 | | | 67 |
Abandoned Projects | | | 1,356 | | | 1,133 |
Changes in operating assets and liabilities: | | | | | ||
Accounts Receivable | | | (4,367) | | | 9,896 |
Accounts Receivable from Affiliate | | | (6,808) | | | 4,485 |
Other Receivables | | | 602 | | | (10) |
Prepaids, Deposits and Other Current Assets | | | 1,711 | | | 1,345 |
Accounts Payable | | | (4,817) | | | (1,510) |
Payables to Affiliate | | | (191) | | | 1,235 |
Adjustment in Deferred Revenue | | | (50) | | | 650 |
Accrued Liabilities and Other | | | 4,346 | | | 4,817 |
Net Cash Provided by Operating Activities | | | 30,690 | | | 40,911 |
| | | | | |||
Cash Flow from Investing Activities | | | | | ||
Property, Plant and Equipment Expenditures | | | (42,353) | | | (92,581) |
Net Cash Used in Investing Activities | | | (42,353) | | | (92,581) |
| | | | | |||
Cash Flow from Financing Activities | | | | | ||
Proceeds from Credit Facility | | | — | | | 60,000 |
Repayment of Credit Facility | | | (297,000) | | | — |
Proceeds from Senior-Sustainability Linked Bonds | | | 400,000 | | | — |
Payments of Financing Costs related to Issuance of Senior-Sustainability Linked Bonds | | | (9,352) | | | — |
Payments of Financing Costs related to Credit Facility | | | (1,442) | | | (428) |
Member's Contributions | | | 5 | | | — |
Redemption of Redeemable Preferred Units | | | (74,357) | | | — |
Net Cash Provided by Financing Activities | | | 17,854 | | | 59,572 |
| | | | | |||
Net Increase in Cash and Cash Equivalents | | | 6,191 | | | 7,902 |
| | | | | |||
Cash and Cash Equivalents, Beginning of Period | | | 24,932 | | | 7,083 |
Cash and Cash Equivalents, End of Period | | | $31,123 | | | $14,985 |
| | | Six Months Ended June 30, | ||||
| | | 2021 | | | 2020 | |
Capital Expenditures Incurred but Not Paid Included in Accounts Payable and Accrued Liabilities | | | $17,375 | | | $23,412 |
Asset Retirement Obligation | | | 205 | | | 1,463 |
Accretion and Dividend related to Redeemable Preferred Units | | | 21 | | | (417) |
Equity Issued in Acquisitions | | | — | | | 77,602 |
Redeemable Preferred Units Issued in Acquisition | | | — | | | 71,974 |
Cash Paid for Interest | | | 5,418 | | | 5,055 |
• | Level 1—Inputs are unadjusted quoted prices in active markets for identical assets or liabilities that the Company has the ability to access at the measurement date; |
• | Level 2—Inputs other than Level 1 that are observable, either directly or indirectly, such as quoted prices for similar assets or liabilities in active markets, quoted prices for identical or similar assets or liabilities in markets that are not active or other inputs corroborated by observable market data for substantially the full term of the assets or liabilities; and |
• | Level 3—Unobservable inputs that reflect the Company’s assumptions that market participants would use in pricing assets or liabilities based on the best information available. |
| | | June 30, 2021 | | | December 31, 2020 | |||||||
| | | Carrying Amount | | | Fair Value | | | Carrying Amount | | | Fair Value | |
Sustainability-Linked Bonds | | | $400,000 | | | $426,000 | | | $— | | | $— |
Credit Facility | | | $— | | | $— | | | $297,000 | | | $297,000 |
| | | ||
Fair Value of Consideration | | | |
Class A Units Issued to Seller | | | $77,602 |
Redeemable Preferred Units Issued to Seller | | | 71,974 |
Total Consideration | | | 149,576 |
| | | ||
Fair Value of Assets and Liabilities Acquired | | ||
Property, Plant & Equipment – Water Handling Facilities | | | 18,566 |
Property, Plant & Equipment – Pipelines (including right of way) | | | 33,897 |
Intangibles – Contracts | | | 90,300 |
Asset Retirement Obligations | | | (776) |
Fair Value of Assets and Liabilities Acquired | | | 141,987 |
Total Assets Acquired | | | 141,987 |
Goodwill | | | $7,589 |
| | | For the Six Months Ended June 30, 2020 | |
Pro forma (unaudited) | | | |
Total Revenues | | | $3,677 |
Net Income | | | 1,438 |
Customer contracts | | | June 30, 2021 | | | December 30, 2020 |
Gross value | | | $365,032 | | | $365,032 |
Accumulated amortization | | | (43,799) | | | (27,497) |
Net value | | | $321,233 | | | $337,535 |
| | | Amount | |
Remaining 2021 | | | $16,303 |
2022 | | | 36,735 |
2023 | | | 37,404 |
2024 | | | 36,888 |
2025 | | | 35,050 |
Thereafter | | | 158,853 |
| | | June 30, 2021 | | | December 31, 2020 | |
Accrued Operating Expenses | | | $14,158 | | | $14,367 |
Accrued Capital Expenses | | | 11,320 | | | 6,292 |
Accrued Interest Expense | | | 7,625 | | | 2,661 |
Other | | | 4,156 | | | 4,518 |
Total Accrued and Other Liabilities | | | $37,259 | | | $27,838 |
| | | June 30, 2021 | | | December 31, 2020 | |
Revolving Credit Facility | | | $— | | | $297,000 |
7.625% Senior Sustainability-Linked Notes | | | 400,000 | | | — |
Less: Unamortized deferred financing costs on 7.625% Senior Sustainability-Linked Notes | | | (8,885) | | | — |
Total Long-term debt | | | $391,115 | | | $297,000 |
| | | Remaining 2021 | | | 2022 | | | 2023 | | | 2024 | | | 2025 | | | Thereafter | | | Total | |
Purchase commitments | | | $10,731 | | | $— | | | $— | | | $— | | | $— | | | $— | | | $10,731 |
Surface use and compensation agreement obligation | | | — | | | 1,100 | | | 1,150 | | | 1,200 | | | 1,250 | | | 5,750 | | | 10,450 |
Operating leases | | | 376 | | | 765 | | | 631 | | | 622 | | | 514 | | | 1,255 | | | 4,163 |
Total | | | $11,107 | | | $1,865 | | | $1,781 | | | $1,822 | | | $1,764 | | | $7,005 | | | $25,344 |
| | | Three Months Ended June 30, | | | Six Months Ended June 30, | |||||||
| | | 2021 | | | 2020 | | | 2021 | | | 2020 | |
Revenue | | | $29,292 | | | $12,495 | | | $51,886 | | | $27,772 |
Operating expenses reimbursed to ConocoPhillips | | | (73) | | | (168) | | | 728 | | | 1,973 |
| | | December 31, | ||||
| | | 2020 | | | 2019 | |
Assets | | | | | ||
Cash and cash equivalents | | | $24,932 | | | $7,083 |
Accounts receivable, net | | | 22,457 | | | 33,523 |
Accounts receivable from affiliates | | | 10,642 | | | 15,837 |
Other receivables | | | 3,722 | | | 63 |
Prepaids, deposits and other current assets | | | 4,315 | | | 4,257 |
Total current assets | | | 66,068 | | | 60,763 |
Total property, plant and equipment, net | | | 618,188 | | | 481,790 |
Goodwill | | | 34,585 | | | 26,357 |
Intangibles, net | | | 337,535 | | | 267,648 |
Other assets | | | 1,429 | | | 1,676 |
Total assets | | | $1,057,805 | | | $838,234 |
| | | | | |||
Liabilities, mezzanine equity and members' equity | | | | | ||
Accounts payable | | | $16,067 | | | $40,768 |
Accrued and other current liabilities | | | 29,722 | | | 28,398 |
Total current liabilities | | | 45,789 | | | 69,166 |
Deferred revenue liability | | | 1,300 | | | — |
Asset retirement obligation | | | 5,291 | | | 3,375 |
Long-term debt | | | 297,000 | | | 220,000 |
Other long-term liabilities | | | 132 | | | 185 |
Total liabilities | | | 349,512 | | | 292,726 |
Commitments and contingencies (Note 12) | | | | | ||
Mezzanine equity: | | | | | ||
Redeemable preferred units, $10,000.00 par value, 7,500 issued and 7,307 outstanding as of December 31, 2020 and none issued and outstanding as of December 31, 2019 | | | 74,378 | | | — |
Members' Equity | | | | | ||
Class A units, $10.00 par value, 27,797,207 issued and outstanding as of December 31, 2020 and 22,103,709 issued and outstanding as of December 31, 2019 | | | 318,394 | | | 232,945 |
Class B units, $10.00 par value, 3,556,051 issued and outstanding as of December 31, 2020 and 3,440,083 issued and outstanding as of December 31, 2019 | | | 37,023 | | | 36,296 |
Class C units, $0.00 par value, 806,100 issued and outstanding as of December 31, 2020 and 832,500 issued and outstanding as of December 31, 2019 | | | — | | | — |
Class D units, $10.00 par value, 6,651,100 issued and outstanding as of December 31, 2020 and 6,385,948 issued and outstanding as of December 31, 2019 | | | 278,498 | | | 276,267 |
Total members' equity | | | 633,915 | | | 545,508 |
Total liabilities, mezzanine equity and members’ equity | | | $1,057,805 | | | $838,234 |
| | | For the years ended December 31, | ||||
| | | 2020 | | | 2019 | |
Revenue | | | | | ||
Produced Water Handling | | | $141,659 | | | $81,418 |
Water Solutions | | | 29,813 | | | 37,375 |
Total revenue | | | 171,472 | | | 118,793 |
| | | | | |||
Cost of revenue | | | | | ||
Direct operating costs | | | 95,431 | | | 71,973 |
Depreciation, amortization and accretion | | | 44,027 | | | 19,670 |
Total cost of revenue | | | 139,458 | | | 91,643 |
| | | | | |||
Operating expenses | | | | | ||
General and administrative | | | 18,663 | | | 15,299 |
(Gain) loss on disposal of asset, net | | | 133 | | | (5,100) |
Transaction costs | | | 3,389 | | | 1,010 |
Abandoned projects | | | 2,125 | | | 2,444 |
Total operating expenses | | | 24,310 | | | 13,653 |
Operating income | | | 7,704 | | | 13,497 |
| | | | | |||
Other expense | | | | | ||
Other expense | | | — | | | 176 |
Interest expense | | | 7,674 | | | 260 |
Total other expense | | | 7,674 | | | 436 |
Income before taxes | | | 30 | | | 13,061 |
Income tax expense | | | 23 | | | 1 |
Net income | | | $7 | | | $13,060 |
Accretion and dividend related to redeemable preferred units | | | (4,335) | | | — |
Net income (loss) attributable to members' equity | | | $(4,328) | | | $13,060 |
| | | Class A | | | Class B | | | Class C | | | Class D | | | Total Members’ Equity | |||||||||||||
| | | Units | | | Amount | | | Units | | | Amount | | | Units | | | Amount | | | Units | | | Amount | | |||
Balance at January 1, 2019 | | | 17,631 | | | $177,879 | | | 2,921 | | | $29,486 | | | 846 | | | $— | | | — | | | $— | | | $207,365 |
Capital contributions | | | 4,473 | | | 44,729 | | | 519 | | | 5,189 | | | — | | | — | | | — | | | — | | | 49,918 |
Issuance of Class D units as consideration for the asset acquisition of certain Concho assets in Eddy County, New Mexico and Reeves & Culberson Counties, Texas | | | — | | | — | | | — | | | — | | | — | | | — | | | 6,386 | | | 275,165 | | | 275,165 |
Issuance of Class C units | | | — | | | — | | | — | | | — | | | 141 | | | — | | | — | | | — | | | — |
Forfeiture of Class C units | | | — | | | — | | | — | | | — | | | (154) | | | — | | | — | | | — | | | — |
Net income | | | — | | | 10,337 | | | — | | | 1,621 | | | — | | | — | | | — | | | 1,102 | | | 13,060 |
Balance at December 31, 2019 | | | 22,104 | | | 232,945 | | | 3,440 | | | 36,296 | | | 833 | | | — | | | 6,386 | | | 276,267 | | | 545,508 |
| | | | | | | | | | | | | | | | | | | ||||||||||
Capital contributions | | | 939 | | | 9,391 | | | 116 | | | 1,160 | | | — | | | — | | | 265 | | | 2,652 | | | 13,203 |
Issuance of Class A units as consideration for the asset acquisition of certain Concho assets in Lea County, New Mexico | | | 4,561 | | | 77,602 | | | — | | | — | | | — | | | — | | | — | | | — | | | 77,602 |
Redeemable preferred units converted in lieu of cash capital call | | | 193 | | | 1,930 | | | — | | | — | | | — | | | — | | | — | | | — | | | 1,930 |
Issuance of Class C units | | | — | | | — | | | — | | | — | | | 16 | | | — | | | — | | | — | | | — |
Forfeiture of Class C units | | | — | | | — | | | — | | | — | | | (42) | | | — | | | — | | | — | | | — |
Accretion and dividend related to redeemable preferred units | | | — | | | (3,479) | | | — | | | (434) | | | — | | | — | | | — | | | (422) | | | (4,335) |
Net income | | | — | | | 5 | | | — | | | 1 | | | — | | | — | | | — | | | 1 | | | 7 |
Balance at December 31, 2020 | | | 27,797 | | | $318,394 | | | 3,556 | | | $37,023 | | | 807 | | | $— | | | 6,651 | | | $278,498 | | | $633,915 |
| | | For the year ended | ||||
| | | December 31, 2020 | | | December 31, 2019 | |
Cash flow from operating activities | | | | | ||
Net income | | | $7 | | | $13,060 |
Adjustments to reconcile net income to net cash provided by operating activities: | | | | | ||
Depreciation, amortization & accretion | | | 44,027 | | | 19,670 |
Amortization of deferred financing costs | | | 783 | | | 511 |
(Gain) loss on disposal of asset, net | | | 133 | | | (5,100) |
Abandoned projects | | | 2,125 | | | 2,444 |
Bad debt expense | | | 446 | | | 119 |
Changes in operating assets and liabilities: | | | | | ||
Accounts receivable | | | 10,620 | | | (20,228) |
Accounts receivable from affiliates | | | 5,195 | | | (15,531) |
Other receivables | | | (3,659) | | | (54) |
Prepaids, deposits and other current assets | | | (58) | | | (2,491) |
Accounts payable | | | 193 | | | 4,583 |
Accrued liabilities and other | | | 6,659 | | | 7,166 |
Deferred revenue liability | | | 1,300 | | | — |
Net cash provided by operating activities | | | 67,771 | | | 4,149 |
Cash flow from investing activities | | | | | ||
Cash paid for business acquisitions | | | — | | | (55,430) |
Property, plant and equipment expenditures | | | (139,589) | | | (182,964) |
Cash proceeds from sale of property, plant and equipment | | | — | | | 10,026 |
Net cash used in investing activities | | | (139,589) | | | (228,368) |
Cash flow from financing activities | | | | | ||
Proceeds from Credit Facility | | | 77,000 | | | 200,000 |
Repayment of Credit Facility | | | — | | | (25,000) |
Payments of financing costs | | | (536) | | | (959) |
Member's contributions | | | 13,203 | | | 49,918 |
Net cash provided by financing activities | | | 89,667 | | | 223,959 |
Net increase (decrease) in cash and cash equivalents | | | 17,849 | | | (260) |
| | | | | |||
Cash and cash equivalents, beginning of year | | | 7,083 | | | 7,343 |
Cash and cash equivalents, end of year | | | $24,932 | | | $7,083 |
Supplemental cash flow disclosure | | | | | ||
Non-cash investing activities | | | | | ||
Asset retirement obligations | | | $1,690 | | | $2,480 |
Equity issued in acquisitions | | | 77,602 | | | 275,165 |
Redeemable preferred units issued in acquisitions | | | 71,974 | | | — |
Redeemable preferred units converted in lieu of cash capital call | | | 1,930 | | | — |
Capital expenditures incurred but not paid included in accounts payable and accrued liabilities | | | 13,183 | | | 43,465 |
Accretion and dividend related to redeemable preferred units | | | 4,335 | | | — |
Cash paid for: | | | | | ||
Interest | | | 8,610 | | | 5,978 |
Useful Life | |||
Pipelines | | | 30-50 years |
Wells, facilities and related equipment | | | 30 years |
Water ponds | | | 30 years |
Vehicles | | | 10 years |
Office furniture, equipment and improvements | | | 7 years |
Computer and other equipment | | | 5 years |
• | Level 1 – Inputs are unadjusted quoted prices in active markets for identical assets or liabilities that the Company has the ability to access at the measurement date; |
• | Level 2 – Inputs other than Level 1 that are observable, either directly or indirectly, such as quoted prices for similar assets or liabilities in active markets, quoted prices for identical or similar assets or liabilities in markets that are not active or other inputs corroborated by observable market data for substantially the full term of the assets or liabilities; and |
• | Level 3 – Unobservable inputs that reflect the Company’s assumptions that market participants would use in pricing assets or liabilities based on the best information available. |
Fair value of consideration | | | |
Class A units issued to seller | | | $77,602 |
Redeemable Preferred Units issued to seller | | | 71,974 |
Total consideration | | | $149,576 |
| | | ||
Fair value of assets and liabilities acquired | | | |
Property, plant & equipment – water handling facilities | | | 18,566 |
Property, plant & equipment – pipelines (including right-of-way) | | | 33,897 |
Intangibles – contracts | | | 90,300 |
Asset retirement obligations | | | (776) |
Fair value of assets and liabilities acquired | | | 141,987 |
Total assets acquired | | | 141,987 |
Goodwill | | | $7,589 |
Fair value of consideration | | | |
Cash Payment | | | $55,430 |
Class D Units issued to seller | | | 275,165 |
Total consideration | | | $330,595 |
Fair value of assets acquired | | | |
Property, plant & equipment – water handling facilities | | | 35,976 |
Property, plant & equipment – pipelines (including right-of-way) | | | 13,405 |
Property, plant & equipment – casing | | | 850 |
Intangibles – contracts | | | 270,399 |
Asset retirement obligations | | | (1,181) |
Fair value of assets and liabilities acquired | | | 319,449 |
Total assets acquired | | | 319,449 |
Goodwill | | | $11,146 |
| | | For the year ended December 31, 2020 | | | For the year ended December 31, 2019 | |||||||
Pro forma (unaudited) | | | Actual | | | Pro Forma | | | Actual | | | Pro Forma |
Total revenues | | | $172,772 | | | $176,399 | | | $118,793 | | | $137,926 |
Net income | | | 1,307 | | | 2,618 | | | 13,060 | | | 22,311 |
| | | 2020 | | | 2019 | |
Prepaid insurance and other | | | $4,067 | | | $2,979 |
Deposits and other | | | 72 | | | 115 |
Prepaid groundwater | | | 176 | | | 1,163 |
Total | | | $4,315 | | | $4,257 |
| | | 2020 | | | 2019 | |
Wells, facilities and related equipment | | | $331,322 | | | $248,128 |
Pipelines | | | 276,433 | | | 155,551 |
Projects and construction in progress | | | 33,128 | | | 84,881 |
Water ponds | | | 3,774 | | | 2,273 |
Land | | | 2,063 | | | 2,063 |
Vehicles | | | 5,123 | | | 4,370 |
Computer and other equipment | | | 8,994 | | | 3,994 |
Office furniture, equipment & improvements | | | 609 | | | 576 |
Total property, plant and equipment | | | 661,446 | | | 501,836 |
Accumulated depreciation | | | (43,258) | | | (20,046) |
Total property, plant and equipment, net | | | $618,188 | | | $481,790 |
| | | Total | |
Balance as of December 31, 2018 | | | $15,211 |
Additions | | | 11,146 |
Balance as of December 31, 2019 | | | $26,357 |
Additions | | | 7,589 |
Measurement period adjustment | | | 639 |
Balance as of December 31, 2020 | | | $34,585 |
Customer contracts | | | 2020 | | | 2019 |
Gross value | | | $365,032 | | | $274,732 |
Accumulated amortization | | | (27,497) | | | (7,084) |
Net value | | | $337,535 | | | $267,648 |
Year ending December 31, | | | Amount |
2021 | | | $32,605 |
2022 | | | 36,735 |
2023 | | | 37,404 |
2024 | | | 36,888 |
2025 | | | 35,050 |
Thereafter | | | 158,853 |
| | | 2020 | | | 2019 | |
Asset retirement obligation – beginning of year | | | $3,375 | | | $750 |
Liabilities incurred on acquisition | | | 776 | | | 1,181 |
Liabilities incurred | | | 936 | | | 1,298 |
Reduction due to assets sold | | | (22) | | | — |
Accretion | | | 226 | | | 146 |
Asset retirement obligation – end of year | | | $5,291 | | | $3,375 |
| | | For the year ending December 31, | |||||||||||||||||||
| | | 2021 | | | 2022 | | | 2023 | | | 2024 | | | 2025 | | | Thereafter | | | Total | |
Purchase commitments | | | $10,040 | | | $— | | | $— | | | $— | | | $— | | | $— | | | $10,040 |
Surface use and compensation agreement obligation | | | 1,050 | | | 1,100 | | | 1,150 | | | 1,200 | | | 1,250 | | | 5,750 | | | 11,500 |
Operating leases | | | 496 | | | 833 | | | 700 | | | 691 | | | 585 | | | 1,809 | | | 5,114 |
Total | | | $11,586 | | | $1,933 | | | $1,850 | | | $1,891 | | | $1,835 | | | $7,559 | | | $26,654 |
| | | 2020 | | | 2019 | |
Revenue | | | $66,507 | | | $23,245 |
Operating expense | | | 3,532 | | | 2,765 |
| | | June 30, 2021 | |
ASSETS | | | |
Total assets | | | $— |
LIABILITIES AND STOCKHOLDER’S EQUITY | | | |
Total Liabilities | | | $— |
Commitments and Contingencies | | | — |
Stockholder’s Equity: | | | |
Receivable from Solaris Midstream Holdings, LLC | | | $(10) |
Common Stock, $0.01 Par Value; 1,000 Shares Authorized, Issued, and Outstanding at June 30, 2021 | | | 10 |
Total Stockholder’s Equity | | | $— |
Total Liabilities & Stockholder’s Equity | | | $— |
1. | Organization and Background of Business |
2. | Summary of Significant Accounting Policies |
3. | Stockholder's Equity |
Item 13. | Other Expenses of Issuance and Distribution. |
SEC Registration Fee | | | $33,868 |
FINRA Filing Fee | | | 55,303 |
NYSE Listing Fee | | | 250,000 |
Printing Costs | | | 150,000 |
Legal Fees and Expenses | | | 1,000,000 |
Accounting Fees and Expenses | | | 375,000 |
Transfer Agent Fees and Expenses | | | 23,000 |
Miscellaneous Expenses | | | 12,829 |
Total | | | $1,900,000 |
Item 14. | Indemnification of Directors and Officers. |
Item 15. | Recent Sales of Unregistered Securities. |
Item 16. | Exhibits and Financial Statement Schedules. |
Exhibit No. | | | Description of Exhibit |
| | | Form of Underwriting Agreement. | |
| | | Form of Amended and Restated Certificate of Incorporation. | |
| | | Form of Amended and Restated Bylaws. | |
| | | Indenture, dated as of April 1, 2021, among Solaris Midstream Holdings, LLC, the guarantors party thereto and Wells Fargo Bank, National Association, as trustee. | |
| | | Form of Registration Rights Agreement. | |
| | | Opinion of Gibson, Dunn & Crutcher LLP. | |
| | | Form of Fourth Limited Liability Company Agreement of Solaris Midstream Holdings, LLC. | |
| | | Form of Tax Receivable Agreement. | |
| | | Form of Indemnification Agreement. | |
| | | Second Amended and Restated Credit Agreement, dated as of April 1, 2021, among Solaris Midstream Holdings, LLC, the lenders party thereto and Wells Fargo Bank, National Association, as administrative agent and lead arranger. | |
| | | Form of Aris Water Solutions, Inc. 2021 Equity Incentive Plan. | |
| | | Letter Agreement between Solaris Midstream Holdings, LLC and William Zartler dated January 29, 2021. | |
| | | Letter Agreement between Solaris Midstream Holdings, LLC and Amanda Brock dated January 29, 2021. | |
| | | Amended and Restated Water Gathering and Disposal Agreement, dated June 11, 2020, by and among Solaris Midstream DB-NM, LLC, COG Operating LLC, COG Production LLC, Concho Oil & Gas LLC and COG Acreage LP. | |
| | | Form of Director Nomination Agreement. | |
| | | List of subsidiaries of Aris Water Solutions, Inc. | |
| | | Consent of BDO USA, LLP. | |
| | | Consent of BDO USA, LLP. | |
| | | Consent of Gibson, Dunn & Crutcher LLP (included in Exhibit 5.1). | |
| | | Power of Attorney (included on the signature page of the initial filing of this Registration Statement). | |
| | | Consent of Joseph Colonnetta. | |
| | | Consent of Debra G. Coy. | |
| | | Consent of W. Howard Keenan, Jr. | |
| | | Consent of Christopher Manning. | |
| | | Consent of Andrew O’Brien. | |
| | | Consent of Donald C. Templin. | |
| | | Consent of M. Max Yzaguirre. |
* | Previously filed. |
** | Filed herewith. |
† | Management contract or compensatory plan or arrangement. |
# | Certain confidential information contained in this agreement has been omitted because it is both (i) not material and (ii) the type of information that the Company treats as private or confidential. |
Item 17. | Undertakings. |
| | | ARIS WATER SOLUTIONS, INC. | ||||
| | | | ||||
| | | By: | | | /s/ Amanda M. Brock | |
| | | Name: | | | Amanda M. Brock | |
| | | Title: | | | President and Chief Executive Officer | |
Signature | | | Title |
| | | ||
/s/ Amanda M. Brock | | | President and Chief Executive Officer and Director (principal executive officer) |
Amanda M. Brock | | ||
| | | ||
/s/ Brenda R. Schroer | | | Chief Financial Officer (principal financial officer) |
Brenda R. Schroer | | ||
| | | ||
/s/ Dustin A. Hatley | | | Chief Accounting Officer (principal accounting officer) |
Dustin A. Hatley | | ||
| | | ||
/s/ William A. Zartler | | | Executive Chairman |
William A. Zartler | |