http://www.ariswater.com/20241231#ConocoPhillipsMemberhttp://www.ariswater.com/20241231#ConocoPhillipsMemberhttp://www.ariswater.com/20241231#ConocoPhillipsMember00018651872024FYfalsehttp://www.ariswater.com/20241231#AccruedAndOtherLiabilitiesCurrenthttp://www.ariswater.com/20241231#AccruedAndOtherLiabilitiesCurrenthttp://fasb.org/us-gaap/2024#OtherLiabilitiesNoncurrenthttp://fasb.org/us-gaap/2024#OtherLiabilitiesNoncurrenthttp://fasb.org/us-gaap/2024#PropertyPlantAndEquipmentNethttp://www.ariswater.com/20241231#AccruedAndOtherLiabilitiesCurrenthttp://fasb.org/us-gaap/2024#OtherLiabilitiesNoncurrenthttp://fasb.org/us-gaap/2024#OtherLiabilitiesNoncurrent http://www.ariswater.com/20241231#AccruedAndOtherLiabilitiesCurrenthttp://fasb.org/us-gaap/2024#OtherLiabilitiesNoncurrent http://www.ariswater.com/20241231#AccruedAndOtherLiabilitiesCurrent27493565http://fasb.org/us-gaap/2024#DirectOperatingCostshttp://fasb.org/us-gaap/2024#DirectOperatingCostshttp://fasb.org/us-gaap/2024#DirectOperatingCosts0.33330.33330.333341000004100000410000041000000.1050.1050.1050.1050.090.090.090.090.090.090.090.090.090.090.090.0927543565http://www.ariswater.com/20241231#AccruedAndOtherLiabilitiesCurrenthttp://www.ariswater.com/20241231#AccruedAndOtherLiabilitiesCurrenthttp://www.ariswater.com/20241231#AccruedAndOtherLiabilitiesCurrenthttp://www.ariswater.com/20241231#AccruedAndOtherLiabilitiesCurrenthttp://fasb.org/us-gaap/2024#OtherLiabilitiesNoncurrenthttp://fasb.org/us-gaap/2024#OtherLiabilitiesNoncurrenthttp://fasb.org/us-gaap/2024#OtherLiabilitiesNoncurrenthttp://fasb.org/us-gaap/2024#OtherLiabilitiesNoncurrent0001865187aris:DelawareEnergyAssetAcquisitionMember2024-03-312024-03-310001865187us-gaap:TreasuryStockCommonMember2024-01-012024-12-310001865187aris:DelawareEnergyAssetAcquisitionMember2024-01-012024-12-310001865187us-gaap:TreasuryStockCommonMember2023-01-012023-12-310001865187aris:DelawareEnergyAssetAcquisitionMember2023-01-012023-12-310001865187us-gaap:TreasuryStockCommonMember2022-01-012022-12-310001865187us-gaap:PerformanceSharesMemberus-gaap:CommonClassAMemberus-gaap:SubsequentEventMember2025-02-012025-02-280001865187us-gaap:CommonClassBMemberus-gaap:CommonStockMember2024-01-012024-12-310001865187us-gaap:CommonClassAMemberus-gaap:CommonStockMember2024-01-012024-12-310001865187us-gaap:CommonClassBMemberus-gaap:CommonStockMember2023-01-012023-12-310001865187us-gaap:CommonClassAMemberus-gaap:CommonStockMember2023-01-012023-12-310001865187us-gaap:CommonClassBMemberus-gaap:CommonStockMember2022-01-012022-12-310001865187us-gaap:CommonClassAMemberus-gaap:CommonStockMember2022-01-012022-12-310001865187us-gaap:TreasuryStockCommonMember2024-12-310001865187us-gaap:RetainedEarningsMember2024-12-310001865187us-gaap:NoncontrollingInterestMember2024-12-310001865187us-gaap:AdditionalPaidInCapitalMember2024-12-310001865187us-gaap:TreasuryStockCommonMember2023-12-310001865187us-gaap:RetainedEarningsMember2023-12-310001865187us-gaap:NoncontrollingInterestMember2023-12-310001865187us-gaap:AdditionalPaidInCapitalMember2023-12-310001865187us-gaap:TreasuryStockCommonMember2022-12-310001865187us-gaap:RetainedEarningsMember2022-12-310001865187us-gaap:NoncontrollingInterestMember2022-12-310001865187us-gaap:AdditionalPaidInCapitalMember2022-12-310001865187us-gaap:TreasuryStockCommonMember2021-12-310001865187us-gaap:RetainedEarningsMember2021-12-310001865187us-gaap:NoncontrollingInterestMember2021-12-310001865187us-gaap:AdditionalPaidInCapitalMember2021-12-310001865187aris:InsurancePremiumFinancingMember2023-10-012023-12-310001865187aris:TwoThousandTwentyOneEquityIncentivePlanMember2024-12-310001865187aris:TwoThousandTwentyOneEquityIncentivePlanMember2024-05-012024-05-310001865187us-gaap:RestrictedStockMemberaris:TwoThousandTwentyOneEquityIncentivePlanMember2023-12-310001865187us-gaap:PerformanceSharesMemberaris:TwoThousandTwentyOneEquityIncentivePlanMember2023-12-310001865187us-gaap:RestrictedStockMemberaris:TwoThousandTwentyOneEquityIncentivePlanMember2023-01-012023-12-310001865187us-gaap:RestrictedStockMemberaris:TwoThousandTwentyOneEquityIncentivePlanMember2022-01-012022-12-310001865187us-gaap:PerformanceSharesMemberaris:TwoThousandTwentyOneEquityIncentivePlanMember2023-01-012023-12-310001865187us-gaap:PerformanceSharesMemberaris:TwoThousandTwentyOneEquityIncentivePlanMember2022-01-012022-12-310001865187us-gaap:RestrictedStockMemberaris:TwoThousandTwentyOneEquityIncentivePlanMemberus-gaap:ShareBasedCompensationAwardTrancheTwoMember2024-01-012024-12-310001865187us-gaap:RestrictedStockMemberaris:TwoThousandTwentyOneEquityIncentivePlanMemberus-gaap:ShareBasedCompensationAwardTrancheThreeMember2024-01-012024-12-310001865187us-gaap:RestrictedStockMemberaris:TwoThousandTwentyOneEquityIncentivePlanMemberus-gaap:ShareBasedCompensationAwardTrancheOneMember2024-01-012024-12-310001865187aris:WaterSolutionsMemberus-gaap:RelatedPartyMember2024-01-012024-12-310001865187aris:WaterSolutionsMemberus-gaap:NonrelatedPartyMember2024-01-012024-12-310001865187aris:ProducedWaterHandlingMemberus-gaap:RelatedPartyMember2024-01-012024-12-310001865187aris:ProducedWaterHandlingMemberus-gaap:NonrelatedPartyMember2024-01-012024-12-310001865187aris:SkimOilSalesMember2024-01-012024-12-310001865187aris:OtherRevenueMember2024-01-012024-12-310001865187aris:WaterSolutionsMemberus-gaap:RelatedPartyMember2023-01-012023-12-310001865187aris:WaterSolutionsMemberus-gaap:NonrelatedPartyMember2023-01-012023-12-310001865187aris:ProducedWaterHandlingMemberus-gaap:RelatedPartyMember2023-01-012023-12-310001865187aris:ProducedWaterHandlingMemberus-gaap:NonrelatedPartyMember2023-01-012023-12-310001865187aris:SkimOilSalesMember2023-01-012023-12-310001865187aris:OtherRevenueMember2023-01-012023-12-310001865187aris:WaterSolutionsMemberus-gaap:RelatedPartyMember2022-01-012022-12-310001865187aris:WaterSolutionsMemberus-gaap:NonrelatedPartyMember2022-01-012022-12-310001865187aris:ProducedWaterHandlingMemberus-gaap:RelatedPartyMember2022-01-012022-12-310001865187aris:ProducedWaterHandlingMemberus-gaap:NonrelatedPartyMember2022-01-012022-12-310001865187aris:SkimOilSalesMember2022-01-012022-12-310001865187aris:OtherRevenueMember2022-01-012022-12-310001865187srt:MinimumMemberus-gaap:WellsAndRelatedEquipmentAndFacilitiesMember2024-12-310001865187srt:MinimumMemberus-gaap:PipelinesMember2024-12-310001865187srt:MinimumMemberus-gaap:LandBuildingsAndImprovementsMember2024-12-310001865187srt:MinimumMemberaris:VehiclesComputersAndOfficeFurnitureMember2024-12-310001865187srt:MaximumMemberus-gaap:WellsAndRelatedEquipmentAndFacilitiesMember2024-12-310001865187srt:MaximumMemberus-gaap:PipelinesMember2024-12-310001865187srt:MaximumMemberus-gaap:LandBuildingsAndImprovementsMember2024-12-310001865187srt:MaximumMemberaris:VehiclesComputersAndOfficeFurnitureMember2024-12-310001865187us-gaap:MachineryAndEquipmentMember2024-12-310001865187aris:SolarisMidstreamHoldingsLlcAndSubsidiariesMemberaris:WaterStandardManagementUsIncMemberus-gaap:CapitalUnitClassAMember2022-10-012022-10-310001865187aris:SolarisMidstreamHoldingsLlcAndSubsidiariesMemberaris:DelawareEnergyAssetAcquisitionMemberus-gaap:CapitalUnitClassAMember2022-08-012022-08-010001865187us-gaap:SupplyCommitmentMember2024-12-310001865187aris:SurfaceUseAndCompensationMember2024-12-310001865187aris:PurchaseCommitmentsMember2024-12-310001865187aris:FixedPricePowerPurchaseContractMember2024-12-310001865187aris:NewOfficeLeaseMember2023-09-300001865187us-gaap:NotesReceivableMemberaris:OtherReceivablesNetCurrentMemberus-gaap:ConstructionLoansMember2024-12-310001865187us-gaap:SupplyCommitmentMember2023-01-012023-03-310001865187us-gaap:LetterOfCreditMember2024-12-3100018651872022-01-012022-03-3100018651872024-09-300001865187us-gaap:PrepaidExpensesAndOtherCurrentAssetsMember2024-12-310001865187us-gaap:OtherNoncurrentAssetsMember2024-12-310001865187aris:VisionResourcesInc.Memberus-gaap:RelatedPartyMember2024-01-012024-12-310001865187aris:SolarisOilfieldInfrastructureMemberus-gaap:RelatedPartyMember2024-01-012024-12-310001865187aris:SolarisEnergyManagementLlcMemberus-gaap:RelatedPartyMember2024-01-012024-12-310001865187aris:BlancoAviationLlcMemberus-gaap:RelatedPartyMember2024-01-012024-12-310001865187aris:VisionResourcesInc.Memberus-gaap:RelatedPartyMember2023-01-012023-12-310001865187aris:SolarisEnergyManagementLlcMemberus-gaap:RelatedPartyMember2023-01-012023-12-310001865187aris:BlancoAviationLlcMemberus-gaap:RelatedPartyMember2023-01-012023-12-310001865187aris:VisionResourcesInc.Memberus-gaap:RelatedPartyMember2022-01-012022-12-310001865187aris:SolarisEnergyManagementLlcMemberus-gaap:RelatedPartyMember2022-01-012022-12-310001865187aris:BlancoAviationLlcMemberus-gaap:RelatedPartyMember2022-01-012022-12-310001865187us-gaap:RevolvingCreditFacilityMember2023-10-012023-12-310001865187us-gaap:RestrictedStockMemberaris:TwoThousandTwentyOneEquityIncentivePlanMember2024-12-310001865187us-gaap:PerformanceSharesMemberaris:TwoThousandTwentyOneEquityIncentivePlanMember2024-12-310001865187us-gaap:PerformanceSharesMemberaris:TwoThousandTwentyOneEquityIncentivePlanMember2024-01-012024-12-310001865187aris:SolarisMidstreamHoldingsLlcAndSubsidiariesMemberaris:O2025Q1DividendsMemberus-gaap:SubsequentEventMember2025-02-260001865187aris:SolarisMidstreamHoldingsLlcAndSubsidiariesMemberaris:O2024Q4DividendsMember2024-12-310001865187aris:SolarisMidstreamHoldingsLlcAndSubsidiariesMemberaris:O2024Q3DividendsMember2024-09-300001865187aris:SolarisMidstreamHoldingsLlcAndSubsidiariesMemberaris:O2024Q2DividendsMember2024-06-300001865187aris:SolarisMidstreamHoldingsLlcAndSubsidiariesMemberaris:O2024Q1DividendsMember2024-03-310001865187aris:SolarisMidstreamHoldingsLlcAndSubsidiariesMemberaris:O2023Q4DividendsMember2023-12-310001865187aris:SolarisMidstreamHoldingsLlcAndSubsidiariesMemberaris:O2023Q3DividendsMember2023-09-300001865187aris:SolarisMidstreamHoldingsLlcAndSubsidiariesMemberaris:O2023Q2DividendsMember2023-06-300001865187aris:SolarisMidstreamHoldingsLlcAndSubsidiariesMemberaris:O2023Q1DividendsMember2023-03-310001865187aris:SolarisMidstreamHoldingsLlcAndSubsidiariesMemberaris:O2022Q4DividendsMember2022-12-310001865187aris:SolarisMidstreamHoldingsLlcAndSubsidiariesMemberaris:O2022Q3DividendsMember2022-09-300001865187aris:SolarisMidstreamHoldingsLlcAndSubsidiariesMemberaris:O2022Q2DividendsMember2022-06-300001865187aris:SolarisMidstreamHoldingsLlcAndSubsidiariesMemberaris:O2022Q1DividendsMember2022-03-310001865187aris:O2024AdividendsMember2024-01-012024-12-310001865187us-gaap:CommonClassAMember2023-01-012023-12-310001865187aris:O2023AdividendsMember2023-01-012023-12-310001865187us-gaap:CommonClassAMember2022-01-012022-12-310001865187aris:O2022AdividendsMember2022-01-012022-12-310001865187us-gaap:RetainedEarningsMember2024-01-012024-12-310001865187us-gaap:NoncontrollingInterestMember2024-01-012024-12-310001865187us-gaap:RetainedEarningsMember2023-01-012023-12-310001865187us-gaap:NoncontrollingInterestMember2023-01-012023-12-310001865187us-gaap:RetainedEarningsMember2022-01-012022-12-310001865187us-gaap:NoncontrollingInterestMember2022-01-012022-12-310001865187aris:BeneficialReuseStrategicAgreementMember2024-12-310001865187aris:BeneficialReuseStrategicAgreementMember2023-12-310001865187us-gaap:RevolvingCreditFacilityMember2024-12-310001865187us-gaap:RevolvingCreditFacilityMember2023-12-310001865187aris:DebtInstrumentRedemptionOnChangeOfControlMemberaris:SeniorSustainabilityLinkedBondsMember2024-01-012024-12-310001865187aris:SeniorSustainabilityLinkedBondsMemberus-gaap:DebtInstrumentRedemptionPeriodTwoMember2024-01-012024-12-310001865187aris:SeniorSustainabilityLinkedBondsMemberus-gaap:DebtInstrumentRedemptionPeriodOneMember2024-01-012024-12-310001865187us-gaap:RevolvingCreditFacilityMemberus-gaap:EstimateOfFairValueFairValueDisclosureMember2024-12-310001865187us-gaap:RevolvingCreditFacilityMemberus-gaap:CarryingReportedAmountFairValueDisclosureMember2024-12-310001865187aris:SeniorSustainabilityLinkedBondsMemberus-gaap:EstimateOfFairValueFairValueDisclosureMember2024-12-310001865187aris:SeniorSustainabilityLinkedBondsMemberus-gaap:CarryingReportedAmountFairValueDisclosureMember2024-12-310001865187us-gaap:RevolvingCreditFacilityMemberus-gaap:EstimateOfFairValueFairValueDisclosureMember2023-12-310001865187us-gaap:RevolvingCreditFacilityMemberus-gaap:CarryingReportedAmountFairValueDisclosureMember2023-12-310001865187aris:SeniorSustainabilityLinkedBondsMemberus-gaap:EstimateOfFairValueFairValueDisclosureMember2023-12-310001865187aris:SeniorSustainabilityLinkedBondsMemberus-gaap:CarryingReportedAmountFairValueDisclosureMember2023-12-310001865187aris:SeniorSustainabilityLinkedBondsMember2021-04-300001865187us-gaap:RevolvingCreditFacilityMember2024-12-310001865187aris:SeniorSustainabilityLinkedBondsMember2024-12-310001865187us-gaap:RevolvingCreditFacilityMember2023-12-310001865187aris:SeniorSustainabilityLinkedBondsMember2023-12-310001865187aris:SofrBorrowingsMemberus-gaap:SecuredOvernightFinancingRateSofrMember2023-10-012023-10-310001865187aris:BaseRateBorrowingsMemberus-gaap:SecuredOvernightFinancingRateSofrMember2023-10-012023-10-310001865187aris:BaseRateBorrowingsMemberus-gaap:FederalFundsEffectiveSwapRateMember2023-10-012023-10-310001865187srt:MinimumMemberus-gaap:RevolvingCreditFacilityMemberus-gaap:EurodollarMember2021-04-012021-04-300001865187srt:MaximumMemberus-gaap:RevolvingCreditFacilityMemberus-gaap:EurodollarMember2021-04-012021-04-300001865187aris:BaseRateBorrowingsMemberus-gaap:FederalFundsEffectiveSwapRateMember2021-04-012021-04-300001865187aris:BaseRateBorrowingsMemberaris:LondonInterbankOfferedRateMember2021-04-012021-04-300001865187aris:ConocoPhillipsMemberus-gaap:SalesRevenueNetMemberus-gaap:CustomerConcentrationRiskMember2024-01-012024-12-310001865187aris:ConocoPhillipsMemberus-gaap:AccountsReceivableMemberus-gaap:CustomerConcentrationRiskMember2024-01-012024-12-310001865187aris:ChevronCorporationMemberus-gaap:SalesRevenueNetMemberus-gaap:CustomerConcentrationRiskMember2024-01-012024-12-310001865187aris:ChevronCorporationMemberus-gaap:AccountsReceivableMemberus-gaap:CustomerConcentrationRiskMember2024-01-012024-12-310001865187aris:MewbourneOilCompanyIncMemberus-gaap:SalesRevenueNetMemberus-gaap:CustomerConcentrationRiskMember2023-01-012023-12-310001865187aris:ConocoPhillipsMemberus-gaap:SalesRevenueNetMemberus-gaap:CustomerConcentrationRiskMember2023-01-012023-12-310001865187aris:ConocoPhillipsMemberus-gaap:AccountsReceivableMemberus-gaap:CustomerConcentrationRiskMember2023-01-012023-12-310001865187aris:ChevronCorporationMemberus-gaap:SalesRevenueNetMemberus-gaap:CustomerConcentrationRiskMember2023-01-012023-12-310001865187aris:ChevronCorporationMemberus-gaap:AccountsReceivableMemberus-gaap:CustomerConcentrationRiskMember2023-01-012023-12-310001865187aris:MewbourneOilCompanyIncMemberus-gaap:SalesRevenueNetMemberus-gaap:CustomerConcentrationRiskMember2022-01-012022-12-310001865187aris:ConocoPhillipsMemberus-gaap:SalesRevenueNetMemberus-gaap:CustomerConcentrationRiskMember2022-01-012022-12-310001865187aris:ChevronCorporationMemberus-gaap:SalesRevenueNetMemberus-gaap:CustomerConcentrationRiskMember2022-01-012022-12-310001865187us-gaap:CommonClassBMemberus-gaap:CommonStockMember2024-12-310001865187us-gaap:CommonClassAMemberus-gaap:CommonStockMember2024-12-310001865187us-gaap:CommonClassBMemberus-gaap:CommonStockMember2023-12-310001865187us-gaap:CommonClassAMemberus-gaap:CommonStockMember2023-12-310001865187us-gaap:CommonClassBMemberus-gaap:CommonStockMember2022-12-310001865187us-gaap:CommonClassAMemberus-gaap:CommonStockMember2022-12-310001865187us-gaap:CommonClassBMemberus-gaap:CommonStockMember2021-12-310001865187us-gaap:CommonClassAMemberus-gaap:CommonStockMember2021-12-310001865187us-gaap:CommonClassBMember2024-12-310001865187us-gaap:CommonClassBMember2023-12-310001865187us-gaap:CommonClassAMember2023-12-310001865187aris:O2025Q1DividendsMemberus-gaap:CommonClassAMemberus-gaap:SubsequentEventMember2025-01-012025-02-260001865187aris:O2024Q4DividendsMemberus-gaap:CommonClassAMember2024-10-012024-12-310001865187aris:O2024Q3DividendsMemberus-gaap:CommonClassAMember2024-07-012024-09-300001865187aris:O2024Q2DividendsMemberus-gaap:CommonClassAMember2024-04-012024-06-300001865187aris:O2024Q1DividendsMemberus-gaap:CommonClassAMember2024-01-012024-03-310001865187aris:O2023Q4DividendsMemberus-gaap:CommonClassAMember2023-10-012023-12-310001865187aris:O2023Q3DividendsMemberus-gaap:CommonClassAMember2023-07-012023-09-300001865187aris:O2023Q2DividendsMemberus-gaap:CommonClassAMember2023-04-012023-06-300001865187aris:O2023Q1DividendsMemberus-gaap:CommonClassAMember2023-01-012023-03-310001865187aris:O2022Q4DividendsMemberus-gaap:CommonClassAMember2022-10-012022-12-310001865187aris:O2022Q3DividendsMemberus-gaap:CommonClassAMember2022-07-012022-09-300001865187aris:O2022Q2DividendsMemberus-gaap:CommonClassAMember2022-04-012022-06-300001865187aris:O2022Q1DividendsMemberus-gaap:CommonClassAMember2022-01-012022-03-3100018651872021-12-310001865187aris:DelawareEnergyAssetAcquisitionMember2022-08-0100018651872022-12-310001865187aris:DelawareEnergyAssetAcquisitionMember2024-12-310001865187aris:DelawareEnergyAssetAcquisitionMember2023-12-310001865187aris:DelawareEnergyAssetAcquisitionMember2024-01-012024-03-310001865187aris:DelawareEnergyAssetAcquisitionMember2023-07-012023-12-310001865187srt:MaximumMemberaris:CrosstekAcquisitionMemberus-gaap:SubsequentEventMember2025-02-012025-02-280001865187us-gaap:PerformanceSharesMember2024-01-012024-12-310001865187us-gaap:CommonClassBMember2024-01-012024-12-310001865187us-gaap:PerformanceSharesMember2023-01-012023-12-310001865187us-gaap:CommonClassBMember2023-01-012023-12-310001865187us-gaap:PerformanceSharesMember2022-01-012022-12-310001865187us-gaap:CommonClassBMember2022-01-012022-12-310001865187us-gaap:OperatingExpenseMember2024-01-012024-12-310001865187us-gaap:GeneralAndAdministrativeExpenseMember2024-01-012024-12-310001865187us-gaap:OperatingExpenseMember2023-01-012023-12-310001865187us-gaap:GeneralAndAdministrativeExpenseMember2023-01-012023-12-310001865187us-gaap:OperatingExpenseMember2022-01-012022-12-310001865187us-gaap:GeneralAndAdministrativeExpenseMember2022-01-012022-12-310001865187us-gaap:StateAndLocalJurisdictionMember2024-12-310001865187us-gaap:DomesticCountryMember2024-12-310001865187us-gaap:StateAndLocalJurisdictionMember2023-12-310001865187us-gaap:DomesticCountryMember2023-12-310001865187us-gaap:RelatedPartyMember2023-01-010001865187us-gaap:NonrelatedPartyMember2023-01-010001865187aris:VisionResourcesInc.Memberus-gaap:RelatedPartyMember2024-12-310001865187aris:SolarisOilfieldInfrastructureMemberus-gaap:RelatedPartyMember2024-12-310001865187aris:SolarisEnergyCapitalllcMemberus-gaap:RelatedPartyMember2024-12-310001865187us-gaap:RelatedPartyMember2024-12-310001865187us-gaap:NonrelatedPartyMember2024-12-310001865187srt:AffiliatedEntityMember2024-12-310001865187aris:VisionResourcesInc.Memberus-gaap:RelatedPartyMember2023-12-310001865187aris:SolarisOilfieldInfrastructureMemberus-gaap:RelatedPartyMember2023-12-310001865187aris:SolarisEnergyCapitalllcMemberus-gaap:RelatedPartyMember2023-12-310001865187us-gaap:RelatedPartyMember2023-12-310001865187us-gaap:NonrelatedPartyMember2023-12-310001865187srt:AffiliatedEntityMember2023-12-3100018651872024-10-012024-12-3100018651872024-06-300001865187us-gaap:CommonClassBMember2025-02-240001865187us-gaap:CommonClassAMember2025-02-240001865187aris:SolarisMidstreamHoldingsLlcAndSubsidiariesMemberus-gaap:CommonClassAMember2024-12-310001865187aris:SolarisMidstreamHoldingsLlcAndSubsidiariesMemberus-gaap:CommonClassAMember2023-12-310001865187aris:SolarisMidstreamHoldingsLlcAndSubsidiariesMemberus-gaap:CommonClassAMember2022-12-310001865187aris:TaxReceivableAgreementMember2024-12-310001865187aris:TaxReceivableAgreementMember2023-12-310001865187aris:TaxReceivableAgreementMember2022-12-310001865187aris:SolarisMidstreamHoldingsLlcMemberus-gaap:CommonClassAMember2021-10-262021-10-260001865187us-gaap:RestrictedStockMemberaris:TwoThousandTwentyOneEquityIncentivePlanMember2024-01-012024-12-310001865187aris:SolarisEnergyManagementLlcMemberus-gaap:RelatedPartyMember2024-12-310001865187aris:SolarisEnergyManagementLlcMemberus-gaap:RelatedPartyMember2023-12-310001865187us-gaap:CommonClassAMember2024-12-310001865187aris:OtherReceivablesNetCurrentMemberaris:BeneficialReuseStrategicAgreementMember2024-12-310001865187aris:OtherReceivablesNetCurrentMemberaris:BeneficialReuseStrategicAgreementMember2023-12-310001865187us-gaap:WellsAndRelatedEquipmentAndFacilitiesMember2024-12-310001865187us-gaap:PipelinesMember2024-12-310001865187aris:VehiclesEquipmentComputersAndOfficeFurnitureMember2024-12-310001865187us-gaap:WellsAndRelatedEquipmentAndFacilitiesMember2023-12-310001865187us-gaap:PipelinesMember2023-12-310001865187aris:VehiclesEquipmentComputersAndOfficeFurnitureMember2023-12-310001865187aris:InsurancePremiumFinancingMember2024-01-012024-12-310001865187aris:InsurancePremiumFinancingMember2023-01-012023-12-310001865187aris:RelativePerformanceSharesMemberaris:TwoThousandTwentyOneEquityIncentivePlanMember2024-01-012024-12-310001865187aris:AbsolutePerformanceSharesMemberaris:TwoThousandTwentyOneEquityIncentivePlanMember2024-01-012024-12-310001865187srt:AffiliatedEntityMember2024-01-012024-12-310001865187srt:AffiliatedEntityMember2023-01-012023-12-310001865187srt:AffiliatedEntityMember2022-01-012022-12-3100018651872023-10-012023-12-310001865187us-gaap:CommonClassAMember2024-01-012024-12-310001865187aris:OtherAssetsAcquisitionMember2022-07-012022-12-310001865187aris:SolarisMidstreamHoldingsLlcAndSubsidiariesMember2024-01-012024-12-310001865187aris:SolarisMidstreamHoldingsLlcAndSubsidiariesMember2023-01-012023-12-310001865187aris:SolarisMidstreamHoldingsLlcAndSubsidiariesMember2022-01-012022-12-310001865187aris:InsurancePremiumFinancingMember2024-12-310001865187aris:InsurancePremiumFinancingMember2023-12-310001865187aris:TaxReceivableAgreementMember2024-01-012024-12-310001865187aris:TaxReceivableAgreementMember2023-01-012023-12-310001865187us-gaap:RevolvingCreditFacilityMember2023-01-012023-12-310001865187aris:InsurancePremiumFinancingMember2024-10-012024-12-310001865187us-gaap:RevolvingCreditFacilityMember2023-10-310001865187us-gaap:RevolvingCreditFacilityMember2021-04-300001865187us-gaap:RevolvingCreditFacilityMember2021-04-012021-04-300001865187srt:MinimumMemberus-gaap:RevolvingCreditFacilityMember2023-10-012023-10-310001865187srt:MaximumMemberus-gaap:RevolvingCreditFacilityMember2023-10-012023-10-310001865187us-gaap:RevolvingCreditFacilityMember2023-10-012023-10-310001865187srt:MinimumMemberus-gaap:RevolvingCreditFacilityMember2021-04-012021-04-300001865187srt:MaximumMemberus-gaap:RevolvingCreditFacilityMember2021-04-012021-04-300001865187aris:DebtInstrumentLeverageRatioCovenantTestLevelThereafterMemberus-gaap:RevolvingCreditFacilityMember2021-04-012021-04-300001865187aris:DebtInstrumentLeverageRatioCovenantTestLevelForThirdQuarterOf2021Memberus-gaap:RevolvingCreditFacilityMember2021-04-012021-04-300001865187aris:DebtInstrumentLeverageRatioCovenantTestLevelForFirstTwoQuartersOf2021Memberus-gaap:RevolvingCreditFacilityMember2021-04-012021-04-300001865187us-gaap:PerformanceSharesMemberus-gaap:SubsequentEventMember2025-02-280001865187aris:BeneficialReuseStrategicAgreementMember2024-01-012024-12-310001865187aris:BeneficialReuseStrategicAgreementMember2023-01-012023-12-310001865187aris:BeneficialReuseStrategicAgreementMember2022-01-012022-12-310001865187aris:WaterStandardManagementUsIncMember2022-10-012022-10-310001865187aris:SurfaceAcreageAcquisitionMemberus-gaap:LandMember2024-11-012024-11-300001865187aris:SurfaceAcreageAcquisitionMemberus-gaap:LandImprovementsMember2024-11-012024-11-300001865187aris:DelawareEnergyAssetAcquisitionMemberus-gaap:WellsAndRelatedEquipmentAndFacilitiesMember2022-08-012022-08-010001865187aris:DelawareEnergyAssetAcquisitionMemberus-gaap:PipelinesMember2022-08-012022-08-010001865187aris:DelawareEnergyAssetAcquisitionMember2022-08-012022-08-010001865187aris:CrosstekAcquisitionMemberus-gaap:SubsequentEventMember2025-02-012025-02-280001865187aris:SurfaceAcreageAcquisitionMember2024-11-012024-11-300001865187us-gaap:AdditionalPaidInCapitalMember2024-01-012024-12-310001865187us-gaap:AdditionalPaidInCapitalMember2023-01-012023-12-310001865187us-gaap:AdditionalPaidInCapitalMember2022-01-012022-12-310001865187srt:MinimumMemberaris:SofrBorrowingsMemberus-gaap:SecuredOvernightFinancingRateSofrMember2023-10-012023-10-310001865187srt:MinimumMemberaris:BaseRateBorrowingsMemberus-gaap:SecuredOvernightFinancingRateSofrMember2023-10-012023-10-310001865187srt:MaximumMemberaris:SofrBorrowingsMemberus-gaap:SecuredOvernightFinancingRateSofrMember2023-10-012023-10-310001865187srt:MaximumMemberaris:BaseRateBorrowingsMemberus-gaap:SecuredOvernightFinancingRateSofrMember2023-10-012023-10-310001865187srt:MinimumMemberaris:BaseRateBorrowingsMemberaris:LondonInterbankOfferedRateMember2021-04-012021-04-300001865187srt:MaximumMemberaris:BaseRateBorrowingsMemberaris:LondonInterbankOfferedRateMember2021-04-012021-04-3000018651872024-12-3100018651872023-12-3100018651872023-07-012023-09-3000018651872022-10-012022-12-3100018651872022-07-012022-09-3000018651872022-04-012022-06-3000018651872024-01-012024-12-3100018651872023-01-012023-12-3100018651872022-01-012022-12-31aris:segmentiso4217:USDxbrli:pureutr:acrexbrli:sharesiso4217:USDxbrli:sharesaris:Maris:Assetaris:itemaris:lease

Table of Contents

UNITED STATES

SECURITIES AND EXCHANGE COMMISSION

Washington, D.C. 20549

FORM 10-K

ANNUAL REPORT PURSUANT TO SECTION 13 OR 15(d) OF THE SECURITIES EXCHANGE ACT OF 1934

For the fiscal year ended December 31, 2024

or

TRANSITION REPORT PURSUANT TO SECTION 13 OR 15(d) OF THE SECURITIES EXCHANGE ACT OF 1934

For the transition period from ______ to ______

Commission File Number: 001-40955
Graphic

Aris Water Solutions, Inc.

(Exact name of registrant as specified in its charter)

Delaware

87-1022110

(State or other jurisdiction of incorporation or organization)

(I.R.S. employer identification number)

9651 Katy Freeway, Suite 400

Houston, Texas

77024

(Address of principal executive offices)

(Zip Code)

(832) 304-7003

(Registrant’s telephone number, including area code)

Securities registered pursuant to Section 12(b) of the Act:

Title of each class

Trading Symbol(s)

Name of each exchange on which registered

Class A Common Stock, $0.01 par value per share

ARIS

New York Stock Exchange

Indicate by check mark if the registrant is a well-known seasoned issuer, as defined in Rule 405 of the Securities Act. Yes   No 

Indicate by check mark if the registrant is not required to file reports pursuant to Section 13 or Section 15(d) of the Act. Yes   No 

Indicate by check mark whether the registrant (1) has filed all reports required to be filed by Section 13 or 15(d) of the Securities Exchange Act of 1934 during the preceding 12 months (or for such shorter period that the registrant was required to file such reports), and (2) has been subject to such filing requirements for the past 90 days. Yes   No 

Indicate by check mark whether the registrant has submitted electronically every Interactive Data File required to be submitted pursuant to Rule 405 of Regulation S-T (§232.405 of this chapter) during the preceding 12 months (or for such shorter period that the registrant was required to submit such files). Yes   No 

Indicate by check mark whether the registrant is a large accelerated filer, an accelerated filer, a non-accelerated filer, a smaller reporting company, or an emerging growth company. See the definitions of “large accelerated filer,” “accelerated filer,” “smaller reporting company” and “emerging growth company” in Rule 12b-2 of the Exchange Act.

Large accelerated filer

Accelerated filer

Non-accelerated filer

Smaller reporting company

Emerging growth company

If an emerging growth company indicate by check mark if the registrant has elected not to use the extended transition period for complying with any new or revised financial accounting standards provided pursuant to Section 13(a) of the Exchange Act.

Indicate by check mark whether the registrant has filed a report on and attestation to its management’s assessment of the effectiveness of its internal control over financial reporting under Section 404(b) of the Sarbanes-Oxley Act (15 U.S.C. 7262(b)) by the registered public accounting firm that prepared or issued its audit report.

If securities are registered pursuant to Section 12(b) of the Act, indicate by check mark whether the financial statements of the registrant included in the filing reflect the correction of an error to previously issued financial statements.

Indicate by check mark whether any of those error corrections are restatements that required a recovery analysis of incentive-based compensation received by any of the registrant’s executive officers during the relevant recovery period pursuant to § 240.10D-1(b).

Indicate by check mark whether the registrant is a shell company (as defined in Rule 12b-2 of the Exchange Act). Yes  No 

Aggregate market value of Common Stock held by nonaffiliates as of June 30, 2024: $507.4 million

As of February 24, 2025, the registrant had 30,971,735 shares of Class A common stock, $0.01 par value per share, and 27,493,565 shares of Class B common stock, $0.01 par value per share, outstanding.

DOCUMENTS INCORPORATED BY REFERENCE

Portions of the Registrant’s definitive proxy statement for the 2025 Annual Meeting of Shareholders (the “2025 Proxy Statement”), which will be filed with the Securities and Exchange Commission within 120 days after December 31, 2024, are incorporated by reference into Part III of this Annual Report on Form 10-K where indicated.
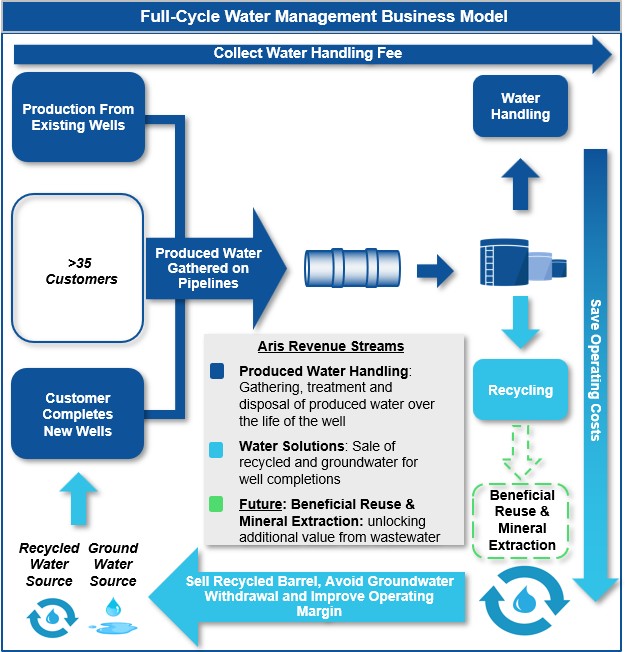
Table of Contents

TABLE OF CONTENTS

Cautionary Note Regarding Forward-Looking Statements

4

Part I

8

Items 1. and 2. Business and Properties

8

Item 1A. Risk Factors

27

Item 1B. Unresolved Staff Comments

56

Item 1C. Cybersecurity

56

Item 3. Legal Proceedings

58

Item 4. Mine Safety Disclosures

58

Part II

58

Item 5. Market for Registrant’s Common Equity, Related Stockholder Matters and Issuer Purchases of Equity Securities

58

Item 6. [Reserved]

61

Item 7. Management’s Discussion and Analysis of Financial Condition and Results of Operations

61

Item 7A. Quantitative and Qualitative Disclosures About Market Risk

82

Item 8. Financial Statements and Supplementary Data

84

Item 9. Changes in and Disagreements With Accountants on Accounting and Financial Disclosure

123

Item 9A. Controls and Procedures

123

Item 9B. Other Information

124

Item 9C. Disclosure Regarding Foreign Jurisdictions that Prevent Inspections

124

Part III

125

Item 10. Directors, Executive Officers and Corporate Governance

125

Item 11. Executive Compensation

125

Item 12. Security Ownership of Certain Beneficial Owners and Management and Related Stockholder Matters

125

Item 13. Certain Relationships and Related Transactions, and Director Independence

125

Item 14. Principal Accountant Fees and Services

125

Part IV

125

Item 15. Exhibits and Financial Statement Schedules

125

Item 16. Form 10-K Summary

127

Signatures

130

2

Table of Contents

. The Bald and Golden Eagle Protection Act.

GLOSSARY OF TERMS

The terms and abbreviations defined in this section are used throughout this Annual Report.

ASC. Accounting Standards Codification

BGEPA. The Bald and Golden Eagle Protection Act.

BLM. Bureau of Land Management.

bwpd. Barrels of water per day.

CAA. The United States Clean Air Act.

CERCLA. The federal Comprehensive Environmental Response, Compensation and Liability Act, also known as the “Superfund law.”

COVID-19. The infectious novel coronavirus disease caused by the “severe acute respiratory syndrome coronavirus 2” (SARS-CoV-2) virus, including variants such as Delta, Omicron and others.

CPI. The Consumer Price Index.

CWA. The Federal Water Pollution Control Act, also known as the Clean Water Act.

Delaware Basin. A geologic depositional and structural basin in West Texas and Southeastern New Mexico which is a part of the Permian Basin, (see below).

DGCL. Delaware General Corporation Law.

E&P. Exploration and production.

EPA. The United States Environmental Protection Agency.

ESA. The Endangered Species Act.

ESG. Environmental, social and governance.

GAAP. Generally accepted accounting principles used in the United States.

GHG. Greenhouse Gas.

IPO. The initial public offering of equity of Aris Water Solutions, Inc. which was completed on October 26, 2021.

kbwpd. One thousand barrels of water per day.

KPI. Key performance indicator.

Legacy Owners. Owners of Solaris LLC units at the time of the IPO.

LIBOR. London Inter-bank Offered Rate.

Midland Basin. A geologic depositional and structural basin in West Texas which is a part of the Permian Basin (see below).

MBTA. The federal Migratory Bird Treaty Act.

MVC. Minimum volume commitment.

NAAQS. The National Ambient Air Quality Standard.

NGL. Natural gas liquids.

NMOCD. The New Mexico Oil Conservation Division.

NORM. Naturally occurring radioactive materials.

NYSE. New York Stock Exchange.

OPEC. The Organization of the Petroleum Exporting Countries.

OPEC+. OPEC plus the countries of Azerbaijan, Bahrain, Brunei, Kazakhstan, Malaysia, Mexico, Oman, Russia, South Sudan and Sudan.

OSHA. The United States Occupational Safety and Health Administration.

PSU. Performance-based restricted stock unit.

3

Table of Contents

Permian Basin. A large sedimentary basin located in West Texas and Southeastern New Mexico.

RCRA. The federal Resource Conservation and Recovery Act.

Sarbanes-Oxley Act. The Sarbanes-Oxley Act of 2002.

SDWA. The federal Safe Drinking Water Act.

SEC. The United States Securities and Exchange Commission.

SOFR. Secured Overnight Financing Rate.

SRA. Seismic Response Area.

TRA. Tax Receivable Agreement.

TRC. The Texas Railroad Commission.

TSCA. The Toxic Substances Control Act.

UIC. Underground Injection Control.

USFWS. The U.S. Fish and Wildlife Service

WTI. West Texas Intermediate, a crude oil pricing index reference.

Introductory Note Regarding Definitions

The registrant, Aris Water Solutions, Inc. (“Aris Inc.”), was incorporated on May 26, 2021 as a Delaware corporation. Aris Inc. was formed to serve as the issuer of equity in an IPO, which was completed on October 26, 2021. Concurrent with the completion of the IPO, Aris Inc. became the new parent holding company of Solaris Midstream Holdings, LLC (“Solaris LLC”), a Delaware limited liability company. Except as otherwise indicated or required by the context, all references to “Aris Inc.,” “Solaris LLC,” the “Company,” “we,” “our,” and “us” or similar terms refer to (i) Solaris LLC and its consolidated subsidiaries before the completion of the Corporate Reorganization in connection with the IPO (discussed in the notes to our consolidated financial statements included in Item 8. Financial Statements and Supplementary Data) and (ii) Aris Inc. and its consolidated subsidiaries as of the completion of the Corporate Reorganization and thereafter.

Cautionary Note Regarding Forward-Looking Statements

This Annual Report on Form 10K (the “Annual Report”) includes “forward-looking statements” within the meaning of Section 27A of the Securities Act of 1933, as amended (the “Securities Act”), and Section 21E of the Securities Exchange Act of 1934, as amended (the “Exchange Act”). All statements other than statements of historical fact contained in this Annual Report, including, without limitation, statements regarding our future results of operations or financial condition, business strategy and plans and objectives of management for future operations, are forward-looking statements. In some cases, you can identify forward-looking statements by terminology such as “anticipate,” “guidance,” “preliminary,” “project,” “estimate,” “outlook,” “expect,” “continue,” “will,” “intend,” “plan,” “targets,” “believe,” “forecast,” “future,” “potential,” “should,” “may,” “possible,” “could” and variations of such words or similar expressions.

You should not rely on forward-looking statements as predictions of future events. We have based the forward-looking statements contained in this Annual Report primarily on our current expectations and projections about future events and trends that we believe may affect our business, financial condition and operating results. The outcome of the events described in these forward-looking statements is subject to risks, uncertainties and other factors described in the section titled “Risk Factors” and elsewhere in this Annual Report, including, but not limited to, the following:

the impact of the ongoing Russia-Ukraine and Middle Eastern conflicts on the global economy, including its impacts on financial markets and the energy industry;

4

Table of Contents

the level of capital spending and development by oil and gas companies, including potential reductions in capital expenditures by oil and gas producers in response to commodity price volatility and/or reduced demand;
our reliance on a limited number of customers and a particular region for substantially all of our revenues;
our ability to successfully implement our business plan;
regional impacts to our business, including our infrastructure assets within the Delaware Basin and Midland Basin formations of the Permian Basin;
our access to capital to fund expansions, acquisitions and our working capital needs and our ability to obtain debt or equity financing on satisfactory terms;
the impact of competition on our operations, including our ability to renew or replace expiring contracts on acceptable terms;
the degree to which our E&P customers may elect to operate their water-management services in-house rather than outsource these services to companies like us;
changes in general economic conditions and commodity prices;
our customers’ ability to complete and produce new wells;
our ability to comply with covenants contained in our debt instruments;
risks related to acquisitions, organic growth projects, and other commercial opportunities that we may pursue, such as using treated produced water for industrial purposes or mineral extraction from produced water, including our ability to realize their expected benefits;
capacity constraints on regional oil, natural gas and water gathering, processing and pipeline systems that result in a slowdown or delay in drilling and completion activity, and thus a slowdown or delay in the demand for our services;
the degree to which consolidation among our customers may affect spending on U.S. drilling and completions in the near-term;
the potential deterioration of our customers’ financial condition, including defaults resulting from actual or potential insolvencies;
our ability to retain key management and employees and to hire and retain skilled labor;
our health, safety and environmental performance;
the impact of current and future laws, rulings and federal and state governmental regulations, including those related to hydraulic fracturing, accessing water, handling of produced water, carbon pricing, taxation of emissions, seismic activity, drilling and right-of-way access on federal and state lands and various other matters;
delays or restrictions in obtaining, utilizing or maintaining permits and/or rights-of-way by us or our customers;

5

Table of Contents

advances in technologies or practices that reduce the amount of water used or produced in the oil and gas production process, thereby reducing demand for our services;
changes in global political or economic conditions, both generally, and in the specific markets we serve;
physical, electronic and cybersecurity breaches;
accidents, weather, seasonality or other events affecting our business;
changes in laws, regulations or policies;
the effects of litigation or other disputes; and
plans, objectives, expectations and intentions contained in this report that are not historical.

Many of the factors that will determine our future results are beyond the ability of management to control or predict. Should one or more of the risks or uncertainties described in this Annual Report occur, or should underlying assumptions prove incorrect, our actual results and plans could differ materially from those expressed in any forward-looking statements. All forward-looking statements, expressed or implied, included in this Annual Report are expressly qualified in their entirety by this cautionary statement.

The forward-looking statements in this Annual Report relate only to events as of the date on which the statements are made. We undertake no obligation to update any forward-looking statements made in this Annual Report to reflect events or circumstances after the date of this Annual Report or to reflect new information or the occurrence of unanticipated events, except as required by law. We may not actually achieve the plans, intentions or expectations disclosed in our forward-looking statements, and you should not place undue reliance on our forward-looking statements. Our forward-looking statements do not reflect the potential impact of any future acquisitions, mergers, dispositions, joint ventures or investments.

For the definitions of certain terms and abbreviations used in this Annual Report, see Glossary of Terms.

Summary of Our Risk Factors

An investment in our Class A common stock involves substantial risks and uncertainties that may materially adversely affect our business, financial condition and results of operations and cash flows. Some of the more significant challenges and risks relating to an investment in our Company are summarized below. The following is only a summary of the principal risks that may materially adversely affect our business, financial condition, results of operations and cash flows. The following should be read in conjunction with the more complete discussion of the risk factors we face, which are set forth in Part I, Item 1A - Risk Factors in this Annual Report.

Risks Related to Our Business

Our business depends on capital spending by the oil and gas industry in the Permian Basin, which could be negatively impacted by industry and market conditions over which we have no control.
If oil prices or natural gas prices remain volatile or were to decline, the demand for our services could be adversely affected, and have an impact on our contract pricing and skim oil sales.
We may be unable to implement price increases or maintain profit margins on our services.

6

Table of Contents

We operate in a highly competitive industry, which could negatively affect our ability to expand our operations, including limiting our access to rights-of-way.
Our inability to acquire new pore space or our loss of existing pore space may negatively impact our ability to service new and existing customers.
Growing or adapting our business by constructing new transportation systems and facilities subjects us to construction risks.
We may face opposition to the development or operation of our water pipelines and facilities from various groups.
Efforts among those in the investment community that are opposed to the oil and natural gas industry may adversely affect our business and access to capital.
We may be unable to attract and retain key members of management, qualified members of our Board of Directors (the “Board”) and other key personnel.
Growth through acquisitions may expose us to various risks, including those related to difficulties in identifying suitable, accretive acquisition opportunities and integrating businesses, assets and personnel.
Inherent risks associated with our operations may not be fully covered under our insurance policies.
The loss of one or more of our significant customers could adversely affect our results of operations.
Because a significant portion of our revenues is derived from ConocoPhillips and Chevron U.S.A. Inc., any development that materially and adversely affects ConocoPhillips’ and Chevron U.S.A. Inc.’s operations, financial condition or market reputation could have a material adverse impact on us.
Our lack of diversification increases the risk of an investment in us and we are vulnerable to risks associated with operating primarily in one geographic area.
We may not be able to keep pace with technological developments in our industry.
We may be required to take write-downs of the carrying values of certain assets and goodwill.
Restrictive covenants under our debt instruments may limit our financial flexibility.
We are subject to cybersecurity attacks on any of our facilities or those of third parties.

Legal and Regulatory Risks

Restrictions on the ability to procure water could decrease the demand for our services.
We may face increased obligations relating to the closing of our water handling facilities.
Fuel conservation measures could reduce demand for our services.
Legislation or regulatory initiatives intended to address seismic activity could restrict our ability to handle or recycle produced water.

7

Table of Contents

Climate change legislation, laws, and regulations could have a material adverse effect on our financial condition, results of operations and cash flows, as well as our reputation.
A portion of our customers’ oil and gas leases are granted by the federal government, which may suspend or terminate such leases.
Laws and regulations related to hydraulic fracturing could result in increased costs and additional operating restrictions that may reduce demand for our services.
Delays or restrictions in obtaining or renewing permits by us for our operations or by our customers for their operations could impair our business.

Risks Related to Our Class A Common Stock

Our sole material asset is our equity interest in Solaris LLC and we are accordingly dependent upon distributions from Solaris LLC to pay taxes and other expenses.
For as long as we are an emerging growth company, we will not be required to comply with certain reporting requirements that apply to other public companies.
Certain of our directors have significant duties with, and spend significant time serving, entities that may compete with us in seeking acquisitions and business opportunities and, accordingly, may have conflicts of interest in allocating time or pursuing business opportunities.
Our governing organizational documents, as well as Delaware law, contain provisions that could discourage acquisition bids or merger proposals.
We cannot assure that we will continue to pay any dividends on our Class A common stock, and our indebtedness could limit our ability to pay dividends on our Class A common stock.
Payments under the Tax Receivable Agreement may be accelerated and/or significantly exceed the actual benefits, if any, we realize in respect of the tax attributes subject to the Tax Receivable Agreement.
We may issue preferred stock whose terms could adversely affect the voting power or value of our Class A common stock.
We may be adversely affected by uncertainty in the global financial markets and a worldwide economic downturn.

You should carefully read and consider the information set forth under Part I, Item 1A - Risk Factors.

Part I

Items 1. and 2. Business and Properties

Our Company

We are a leading, growth-oriented environmental infrastructure and solutions company that directly helps our customers reduce their water and carbon footprints. We deliver full-cycle water handling and recycling solutions that increase the sustainability of energy company operations. Our integrated pipelines and related infrastructure create long-term value by delivering high-capacity, comprehensive produced water management, recycling and supply solutions to operators in the core areas of the Permian Basin.

8

Table of Contents

We provide critical environmental solutions to many of the most active and well-capitalized companies operating in the Permian Basin, including the following companies and/or their affiliates: ConocoPhillips and Chevron U.S.A. Inc. Operators are increasingly focused on minimizing their environmental impact as a measure of success with an emphasis on rapidly increasing the use of recycled produced water in their operations. Our expansive infrastructure, advanced logistics and water treatment methods allow us to reliably gather our customers’ produced water and recycle it for use in their operations. We believe our solutions make a significant contribution to the ability of our customers to achieve their sustainability-related objectives. Since inception, we have been committed to responsibly developing, operating and deploying technology to safely reduce our customers’ environmental footprint.

Our Commitment to Sustainability and Governance Leadership

Our business strategy and operations align with the increasing focus of local communities, regulators and stakeholders on ensuring the safety of oil and gas operations and minimizing environmental and local community impacts. We have a leading track record in environmental stewardship in the areas in which we operate by setting and meeting ambitious sustainability targets. This leadership highlights the strong technical, operational and financial capabilities of our management team that has decades of experience operating and leading companies in the environmental, infrastructure, water treatment and energy industries.

Our business provides reliable and sustainable water solutions which address the operational and environmental demands of the energy industry and actively reduce emissions. Through our significant investment in permanent pipeline infrastructure to safely gather and transport produced water, we minimize the need for produced water trucking, a major contributor of GHG emission, traffic congestion and road safety concerns in the communities in which we operate. Additionally, we are leaders in the evaluation, piloting and advancement of water treatment technologies, including the development of solutions for the use of treated produced water outside of the oil and gas industry. For example, we are piloting and developing proprietary processes for treating produced water for environmental, agricultural and industrial water demand, including evaluating the use of treated produced water as process water for recharging aquifer systems and other industrial uses.

Our strong company culture includes commitments to our employees and our shareholders, which we believe will benefit all of our constituents. We have created a work environment that seeks to provide equal employment opportunities and foster an inclusive company culture. Additionally, we prioritize safety in our operations through rigorous training, structured protocols and ongoing automation of our operations.

We believe alignment of our management and our Board with our shareholders, including the establishment of a well-rounded and independent Board, is conducive to creating long-term value. Additionally, through our management’s substantial equity ownership in us and our incentive compensation programs, our management team remains highly motivated to continue creating shareholder value.

Our Full-Cycle Water Handling and Recycling Solutions

Produced Water

Produced water naturally exists in underground formations and is brought to the surface during crude oil and natural gas production. Produced water is produced throughout the entire life of the well and is of particular importance to operators in the Permian Basin given the high produced water-to-oil ratio prevalent across the basin. Many of our customers have stated goals of managing produced water volumes in an environmentally-responsible and cost-effective manner, highlighting the importance of our water management expertise and integrated and extensive asset base. We believe they will increasingly outsource water management to integrated produced water infrastructure and recycling companies like us to manage their water-related needs in a cost and capital effective manner, creating new business development and acquisition opportunities for us.

9

Table of Contents

Water Recycling

Recycling produced water displaces the use of scarce groundwater which would otherwise be used for oil and gas operations. Treatment of produced water is required prior to reuse, which involves the removal of residual hydrocarbons, reduction of free iron and other solids along with the removal of bacteria to customer specifications. We have made a significant investment in our vast network of produced water gathering pipelines and recycling facilities, which has positioned us as a leading independent third-party provider of recycled produced water gathered on a proprietary network in the Permian Basin. The scale of our system allows us to gather significant produced water volumes across a wide geographic area from multiple customers. The increasing volumes of produced water aggregated on our systems provide differentiated support for our recycling operations and ensures that sufficient volumes of recycled water are available to our customers when and where needed. Our expansive asset base allows us to deliver cost-effective, high-capacity and reliable produced water recycling solutions to operators, encouraging and enabling their rapid adoption of the use of recycled produced water while minimizing the use of groundwater in energy production.

Between July 2019 (the month when we began recycling at scale) and December 31, 2024, we recycled approximately 433 million barrels, or approximately 18.2 billion gallons, of produced water. We are committed to providing our customers with a more secure and sustainable alternative to fresh and other sources of groundwater through our innovative technologies and recycling capabilities. By reducing our customers’ dependence on groundwater, we can contribute to their sustainability efforts and the sustainability of the broader energy industry while also providing benefits to our stakeholders and the communities in which we operate.

Full-Cycle Water Management

The volume of water required for hydraulic fracturing and the volume of produced water generated from oil and gas production have significantly increased in the Permian Basin. Additionally, energy producers are increasingly focused on maximizing sustainability and minimizing the environmental impact in the areas in which they operate. These trends represent significant challenges for energy producers. We provide access to a substantial and growing source of produced water that can be recycled to support energy production. We believe energy producers will increasingly depend on our expansive integrated produced water gathering and recycling assets that are designed specifically to meet these challenges. By developing these partnerships and outsourcing full-cycle produced water management, energy producers can preserve capital for their core operations and ultimately lower water management costs and do so in an environmentally-responsible way.

10

Table of Contents

The figure below demonstrates the movement of produced water through our pipelines for handling or recycling and the multiple points at which we can collect fees on the same barrel of water:

Graphic

Our Operations and Assets

Our Operations

We manage our business through a single operating segment comprising two primary revenue streams, Produced Water Handling and Water Solutions.

Our Produced Water Handling business gathers, transports and, unless recycled, handles produced water generated from oil and natural gas production. Our Produced Water Handling business is supported by long-term contracts with acreage dedications or MVCs, primarily with large, well-capitalized operators.

Our Water Solutions business develops and operates recycling facilities to treat, store and recycle produced water. By aggregating significant volumes of produced water from multiple customers on our connected pipeline networks, we can efficiently recycle large volumes of produced water and deliver this recycled water back to our customers in the time frames, volumes and specifications required by their operations. As

11

Table of Contents

needed, we also supplement our recycled produced water with non-potable groundwater to meet the demands of our customers’ operations.

Our business is driven by gathering produced water volumes for our Produced Water Handling business and delivering recycled water volumes to customers for our Water Solutions business. In our Produced Water Handling business, we grew our handling volumes from approximately 1,042,000 barrels per day for the year ended December 31, 2023 to approximately 1,120,000 barrels per day for the year ended December 31, 2024, an increase of 7%. Within our Water Solutions business, we grew our recycled volumes sold from approximately 324,000 barrels per day on average for the year ended December 31, 2023 to approximately 377,000 barrels per day on average for the year ended December 31, 2024, an increase of 16%, and we decreased our groundwater volumes sold from approximately 126,000 barrels per day on average for the year ended December 31, 2023 to approximately 51,000 barrels per day on average for the year ended December 31, 2024, a decrease of 60% as a result of a shift towards providing more recycled produced water as a proportion of total Water Solutions volumes.

Recent Operating Developments

Surface Acreage Acquisition

In November 2024, we purchased approximately 45,000 surface acres and site improvements (referred to as the “McNeill Ranch Acquisition”) in New Mexico and Texas for total cash consideration of $46.1 million, inclusive of transaction costs, to secure potential disposal capacity for long-term growth. This purchase was considered an asset acquisition, and the allocation of assets consisted of $43.2 million to land and $2.9 million to site improvements and other.

Operating Metrics

Total volumes and per barrel operating metrics were as follows for the periods indicated:

(in thousands, except per barrel data)

Year Ended December 31, 


2024


2023

2022

Produced Water Handling Volumes (kbwpd)

1,120

1,042

873

Water Solutions Volumes (kbwpd) (1)

428

450

411

Total Water Volumes (kbwpd)

1,548

1,492

1,284

Per Barrel Operating Metrics (2)

Produced Water Handling Revenue/Barrel

$

0.84

$

0.78

$

0.77

Water Solutions Revenue/Barrel

$

0.52

$

0.56

$

0.51

Revenue/Barrel of Total Volumes (3)

$

0.75

$

0.72

$

0.68

Direct Operating Costs/Barrel (4)

$

0.31

$

0.33

$

0.30

Gross Margin/Barrel (5)

$

0.31

$

0.25

$

0.24

Adjusted Operating Margin/Barrel (6)

$

0.45

$

0.39

$

0.39

12

Table of Contents

(1)Includes recycled volumes sold of approximately 377,000, 324,000 and 300,000 barrels per day for the years ended December 31, 2024, 2023 and 2022, respectively.
(2)Per barrel operating metrics are calculated independently. Therefore, the sum of individual amounts may not equal the total presented.
(3)Does not include Other Revenue.
(4)Direct operating costs include landowner royalties, power expenses for handling and treatment facilities, direct labor, chemicals for water treatment, water filtration expenses, workover expense and repair and maintenance of facilities.
(5)Gross Margin is calculated as Total Revenue less Total Cost of Revenue.
(6)Adjusted Operating Margin/Barrel is a Non-GAAP measure. See Part II, Item 7. Management’s Discussion and Analysis of Financial Condition and Results of Operations ─ Non-GAAP Financial Measures.

Asset Overview

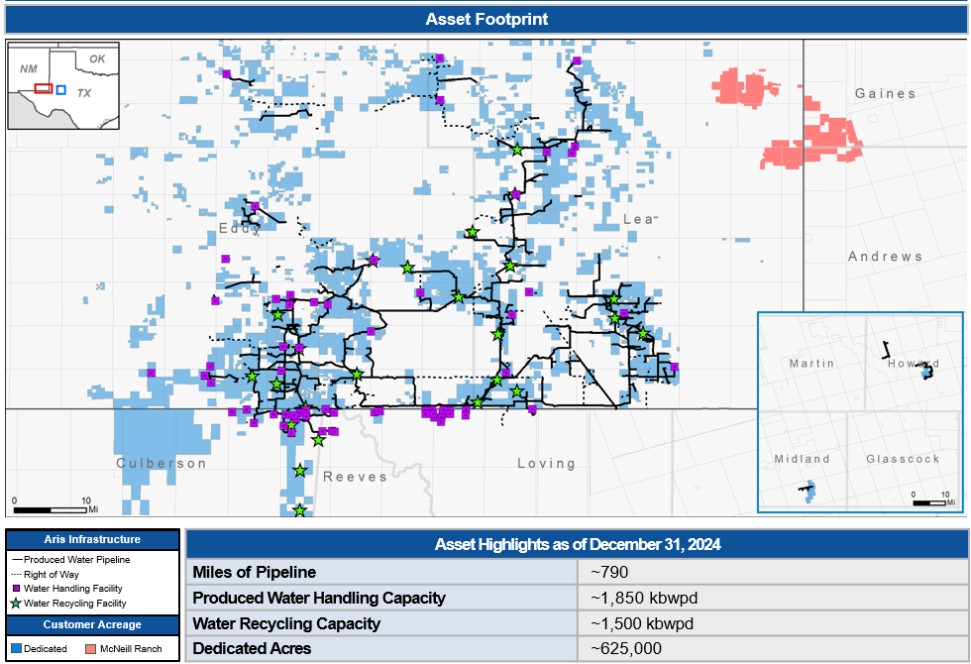
Our recognized operational capability is supported by our automated and high-capacity integrated pipeline network. Our pipeline and water handling assets are comprised primarily of pipelines, pumps and handling and recycling facilities located entirely in the Delaware and Midland sub-basins of the broader Permian Basin. These interconnected assets support both our Produced Water Handling and Water Solutions businesses. We currently have approximately 790 miles of produced water pipeline, which includes approximately 600 miles of larger diameter (12- to 24-inch) pipelines. We have 68 produced water handling facilities and operate 20 high-capacity produced water recycling facilities. Our systems provide an alternative to operators managing their own produced water infrastructure.

13

Table of Contents

The following map describes our active assets as of December 31, 2024:

Graphic

Our Assets

Produced Water Handling Facilities

Our handling facilities, which are designed to process, store and/or dispose of produced water that is not recycled, are essential to our ability to deliver reliable and cost-effective water gathering services to existing and prospective customers across a large geographic footprint. As of December 31, 2024, we have 68 produced water handling facilities which had approximately 1.9 million barrels per day of capacity.

December 31, 2024


Pipelines (Miles)


Number of Water Handling Facilities


Water Handling Capacity (kbwpd)

Installed

790

68

1,850

We have secured significant permits and rights-of-way for additional pipelines and water handling facilities. As of December 31, 2024, we had approximately 195 miles of additional permitted pipeline rights-of-way and approved permits for an additional 23 produced water handling facilities with approximately 0.7 million barrels per day of permitted handling capacity. This backlog of permitted handling capacity provides us with valuable optionality and a competitive advantage as it helps us to react quickly to meet existing and new customer demand without potential permitting delays.

14

Table of Contents

December 31, 2024


Pipelines (miles)


Number of Water Handling Facilities


Water Handling Capacity (kbwpd)

Permitted, Not Installed

195

23

730

Recycling Facilities

Our recycling facilities include water filtration, treatment, storage and redelivery assets. Our recycling facilities are at strategic locations on our pipeline network where there is both significant customer demand for recycled produced water and high volumes of produced water available. As of December 31, 2024, we had 20 facilities operational in the Delaware Basin with approximately 1.5 million barrels per day of treatment capacity and access to approximately 16.4 million barrels of owned or leased storage capacity.

December 31, 2024


Number of Water Recycling Facilities


Water Recycling Capacity (kbwpd)

Active Facilities

20

1,500

We also have the option to rapidly expand our recycling footprint as needed by developing an additional 10 locations that are either permitted or in the process of being permitted. We operate and construct both fixed treatment facilities and modular treatment systems that we can quickly assemble to capitalize on market opportunities.

December 31, 2024


Number of Water Recycling Facilities


Water Recycling Capacity (kbwpd)

Facilities Permitted or in Process of Permitting

10

450

Our Customers and Contracts

Customers

We have long-term contracts with some of the most active and well-capitalized oil and gas operators in the Permian Basin which are increasingly focused on sustainability and minimizing the environmental impact of their operations. Since inception, we have consistently won new contracts and deepened relationships with existing customers, many of which have executed multiple contracts with us. As of December 31, 2024, we have approximately 100 contracts for our Produced Water Handling and Water Solutions businesses with approximately 37 different customers across approximately 625,000 dedicated acres.

As of December 31, 2024, the weighted average remaining life of our produced water handling acreage dedication contracts was approximately 6.8 years. Our largest customers for the year ended December 31, 2024 were affiliates of ConocoPhillips and Chevron U.S.A. Inc. These customers represented approximately 53% of our revenue for the year ended December 31, 2024. See Part II, Item 8. Financial Statements and Supplementary Data – Note 3. Additional Financial Statement Information.

Contracts — Produced Water Handling

As produced water volumes from oil and natural gas production in the Permian Basin have significantly grown in recent years, long-term contract structures like those used in the hydrocarbon midstream sector have been adopted for water services. In our Produced Water Handling business, we primarily enter into two types of contracts with our customers: acreage dedications and MVCs. These contractual arrangements are generally long-term. All produced water transported on our gathering pipeline infrastructure for handling or recycling is subject to fee-based contracts, which are generally subject to limited annual CPI-based adjustments.

15

Table of Contents

Acreage Dedications. Acreage dedications are term contracts pursuant to which a customer dedicates all water produced from current and future wells that they own or operate in a dedicated area to our system. In turn, we commit to gather and handle such produced water. During 2024, we added approximately 10,000 net dedicated acres, while divesting approximately 10,000 acres. As of December 31, 2024, our acreage dedications covered a total of approximately 625,000 acres and had a weighted average remaining life of approximately 6.8 years.

MVCs. Under our MVC contracts, our customers guarantee to (i) deliver a certain minimum daily volume of produced water to our pipeline network at an agreed upon fee, or (ii) pay a deficiency fee if the minimum daily volume is not met for a specified period. As of December 31, 2024, our contracted aggregate MVCs totaled approximately 100,000 bwpd of produced water, and the weighted average remaining life of our MVCs was 2.1 years.

Spot Arrangements. We also enter into spot arrangements whereby we can elect to gather and handle our customers’ produced water to the extent we have capacity on our systems when they request offtake capacity. We refer to these volumes as spot volumes. When producers have a need for produced water handling services at locations which are not otherwise contracted to us, we will enter into spot arrangements in order to utilize available capacity and increase volume throughput on our systems.

Skim Oil Sales. As part of our water processing activities, we aggregate and sell recovered crude oil, also known as skim oil.

The following table provides an overview of our active contracts:

Year Ended December 31,

Percentage of Produced Water Handling Revenue

2024

2023

2022

Acreage Dedication

73%

72%

67%

Minimum Volume Commitments

9%

12%

9%

Spot Volumes

6%

6%

13%

Skim Oil Sales

12%

10%

11%

Total

100%

100%

100%

Acreage dedications and minimum volume commitments were as follows:


December 31, 2024

Acreage Dedications

Acreage Under Contract (thousands of acres)

625

Weighted Average Remaining Life (years)

6.8

Minimum Volume Commitments


Volumetric Commitment (kbwpd)

100

Weighted Average Remaining Life (years)

2.1

Certain contracts included in the table above include both an acreage dedication and a minimum volume commitment. These contracts represent approximately 56,000 acres of the total acreage under contract and 85 kbwpd of the total volumetric commitment.

Delivery Commitment

In 2023, we entered into an agreement with an unaffiliated water disposal company to dispose a minimum volume of produced water over a term of seven years, for a total financial commitment of approximately $28.0 million, undiscounted, and not including annual CPI adjustments. As of December 31, 2024, the remaining minimum commitment was $22.4 million, undiscounted. See Part II, Item 1. Financial Statements Note 13. Commitments and Contingencies for more information.

16

Table of Contents

Contracts ─ Water Solutions

Our Water Solutions contracts are primarily structured as spot contracts or acreage dedications where we agree to supply water, including recycled water, to our customers for their operations.

We believe our integrated business model, history of operational execution, asset footprint and commitment to produced water recycling are important to current and prospective customers and support our leading position in water recycling in the Permian Basin.

Innovation in Recycling and Sustainable Water Management

Our goal is to maximize the amount of produced water we recycle as a percentage of the produced water we gather. We are partnered with leading oil and gas operators, technology providers, scientists and universities in the field of water treatment to identify, adapt and demonstrate innovative technologies for beneficial reuse of produced water. With a focus on commercialization, we are evaluating both technical and economic aspects of best available technologies to safely and effectively generate clean water from produced water. We have identified potential opportunities for clean water generated from produced water including replenishing surface water, supplementing irrigation water demand, industrial cooling and other industrial uses, and future recharging of aquifer systems.

Mineral Extraction Agreement

In the second quarter of 2024, we signed a letter of intent for a development partner to construct an iodine extraction facility, as we continue to evaluate commercial opportunities for mineral extraction. We are in the process of site selection at one of our Permian Basin produced water management facilities, and our goal is for this facility to be operational by the end of 2025.

NAWI

In April 2024, we signed an agreement with the National Alliance for Water Innovation (“NAWI”) to further investigate treatment of produced water using one of the pilot technologies, working with alliance members and Texas A&M University, New Mexico State University, SLAC National Accelerator Laboratory and other parties. Operational data was collected in November 2024 for this study, and the team is in the process of evaluating this data to further our understanding of produced water treatment.

Beneficial Reuse Joint Industry Project

In November 2022, we announced that we had entered into a beneficial reuse strategic agreement (the “Joint Industry Project” or “JIP”) with Chevron U.S.A. Inc. (“Chevron U.S.A.”) and ConocoPhillips to develop and pilot technologies and processes to treat produced water for potential beneficial reuse opportunities. In January 2023, ExxonMobil Corporation joined the JIP, and in July 2024, Coterra Energy Inc. (“Coterra”) joined the JIP. We previously referred to this agreement as the Beneficial Reuse Strategic Agreement.

Our goal under the JIP is to develop cost effective and scalable methods of treating produced water to create a potential water source for industrial, commercial and non-consumptive agricultural purposes. We are leading the engineering, construction and execution of the testing protocols and pilot projects, while leveraging the combined technical expertise of Chevron U.S.A., ConocoPhillips, ExxonMobil and Coterra (collectively with us, the “alliance members”). The treated water has the potential for use in a variety of applications, including non-consumptive agriculture, surface water replenishment and industrial uses. The alliance members are working with appropriate regulators to ensure that end-use applications are properly permitted, including surface discharge. Specifically, we have submitted two permit applications to the Texas Commission on Environmental Quality to permit discharge of clean water to a local reservoir. Our pilot-to-commercialization work with treatment technologies includes several phases, with a goal to complete Phase 1 testing and performance evaluation of pilot technologies by the end of the second quarter of 2025. We are in

17

Table of Contents

the planning process for Phase 2 testing which will build upon and scale Phase 1 and is expected to launch in the second half of 2025.

Water Standard Asset Acquisition

In October 2022, we acquired certain intellectual property rights and related proprietary treatment technologies and assets from Water Standard Management (US), Inc. (“Water Standard”) that are currently being applied onsite in pilot operations to accelerate the advanced treatment and beneficial reuse of produced water in the Permian Basin. See Part II, Item 8. Financial Statements and Supplementary Data – Note 4. Acquisitions.

Our People

As of December 31, 2024, we had a total of 276 employees, 126 of which service our corporate function, and 150 that work in field locations. We hire independent contractors on an as needed basis. We and our employees are not subject to any collective bargaining agreements.

Safety is one of our greatest priorities, and we have implemented safety management systems, procedures, trainings and other tools to help protect our employees and contractors. We strive to hire local employees and have provided mentoring programs for employees to develop specialized skills necessary for our industry. We also provide career development programs to create opportunities for advancement. We encourage development of local leadership and team-based collaboration at our worksites. Our benefits include (i) health care for full-time employees and their eligible dependents, (ii) access to a Safe Harbor 401(k) Plan with a portion eligible for fully-vested employer matched contributions, (iii) basic life, accidental death and dismemberment, and short and long-term disability insurance, (iv) a family and medical leave policy which affords eligible (hourly and salaried) employees with temporary leave for a serious health condition, the care of a family member, or the birth or adoption of a child, (v) paid parental leave following the birth, adoption or placement of a child, (vi) wages that exceed state and federal standards and minimums, and (vii) our 2021 Equity Incentive Plan, which gives most employees an opportunity to share in our success.

We aim to attract and retain talented individuals. Our employee demographic profile aids us in promoting inclusion of thought, skill, knowledge and culture across our organization. As of December 31, 2024, greater than 50% of our workforce is minority and/or female. We also support local communities where we operate by giving to and volunteering with first responders and local charities.

Organizational Structure and Corporate Information

Consolidation

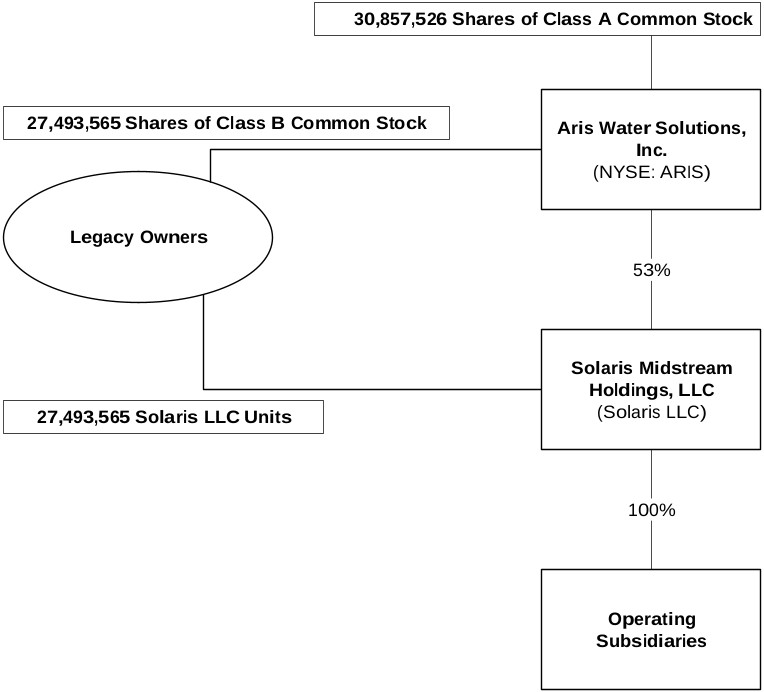
We are a holding company, and our principal asset is a membership interest in Solaris LLC. As the sole managing member of Solaris LLC, we operate and control all of the business and affairs of Solaris LLC, and through Solaris LLC and its subsidiaries, conduct its business. We are responsible for all operational, management and administrative decisions relating to Solaris LLC’s business. As a result, we consolidate the financial results of Solaris LLC and its subsidiaries and report a noncontrolling interest related to the portion of

18

Table of Contents

Solaris LLC units not owned by us, which reduces net income attributable to our Class A common stockholders. As of December 31, 2024, we owned an approximate 53% interest in Solaris LLC.

Ownership Structure

The following diagram reflects our ownership structure as of December 31, 2024:

Graphic

Redemption Rights

Under the Solaris LLC Agreement, Legacy Owners of Solaris LLC units, subject to certain limitations, have the right, pursuant to a redemption right, to cause Solaris LLC to acquire all or a portion of their Solaris LLC units for, at Solaris LLC’s election, (x) shares of our Class A common stock at a redemption ratio of one share of Class A common stock for each Solaris LLC unit redeemed, subject to conversion rate adjustments for stock splits, stock dividends and reclassifications or (y) an equivalent amount of cash. Alternatively, upon the exercise of the redemption right, we have the right, pursuant to a call right, to acquire each tendered Solaris LLC unit directly from the Legacy Owner for, at our election, (x) one share of Class A common stock or (y) an equivalent amount of cash.

During the years ended December 31, 2024, 2023 and 2022, 50,000, 31,954 and 4,140,585 Solaris LLC units, respectively, were converted (together with an equal number of shares of Class B common stock) into shares of our Class A common stock. As of December 31, 2024, we owned an approximate 53% interest in Solaris LLC, and the Legacy Owners owned an approximate 47% interest in Solaris LLC.

19

Table of Contents

General

Aris Inc. was incorporated as a Delaware corporation on May 26, 2021. Our principal executive office is located at 9651 Katy Freeway, Suite 400, Houston, Texas 77024, and we have additional offices in Midland, Texas and Carlsbad, New Mexico.

Our website address is www.ariswater.com. Our Annual Report on Form 10-K, Quarterly Reports on Form 10-Q, Current Reports on Form 8-K and amendments to reports filed or furnished pursuant to Sections 13(a) and 15(d) of the Exchange Act are available, free of charge, through our website, as soon as reasonably practicable after those reports and other information are electronically filed with or furnished to the SEC.

We webcast our earnings calls and certain events we participate in or host with members of the investment community on our investor relations website. Additionally, we provide notifications of news or announcements regarding our financial performance, including SEC filings, investor events and presentations and press and earnings releases, as part of our investor relations website. We intend for our website to serve as distribution channels of material company information for purposes of Regulation FD.

Information contained on our website or linked therein or otherwise connected thereto does not constitute part of and is not incorporated by reference into this Annual Report.

Competition

We compete with public and private water infrastructure companies as well as operators developing systems in-house for produced water handling and recycling in the areas in which we operate. Competition in the water infrastructure industry is based on the geographic location of facilities, business reputation, operating reliability and flexibility, business service offerings, available capacity and pricing arrangements for the services offered. We compete with other companies that provide similar services in our areas of operations, but we benefit from our relationships with large operators in the Permian Basin, including ConocoPhillips, and our reputation as a proven, reliable service provider and our deep commitment to recycling and sustainability. As we seek to expand our water gathering, recycling and handling services to new customers, we will continue to face a high level of competition.

Seasonality

In general, seasonal factors have not had a significant direct effect on our business other than timing impacts of oil and gas completion activity that have historically been weighted to the back half of the year. However, extreme weather conditions during parts of the year could adversely impact the well-completion activities of our customers, who are oil and natural gas operators, and/or affect their ability to flow gas, which may result in temporary curtailments and shut-in wells, thereby reducing the amount of produced water to be gathered and either recycled or handled, as well as the volume of Water Solutions barrels sold to our customers.

Insurance

Our assets may experience physical damage as a result of an accident or natural disaster. These hazards can also cause personal injury and loss of life, severe damage to and destruction of property and equipment, pollution or environmental damage and suspension of operations. Litigation arising from such an event may result in us being named a defendant in lawsuits asserting large claims. We maintain our own general liability, product liability, property, business interruption, directors’ and officers’ liability, workers compensation, cybersecurity and pollution liability insurance policies, among other policies, at varying levels of deductibles and limits that we believe are reasonable and prudent under the circumstances to cover our operations and assets. As we continue to grow, we will continue to evaluate our policy limits and retentions as they relate to the overall cost and scope of our insurance program.

20

Table of Contents

Regulation

We are subject to a variety of laws in connection with our operations, including those related to the environment, health and safety, personal privacy and data protection, intellectual property, advertising and marketing, labor, competition and taxation. These laws and regulations are constantly evolving and may be interpreted, implemented, amended or revised in a manner that could harm our business. It also is possible that as our business grows and evolves, we will become subject to additional laws and regulations. There is no assurance that compliance with current laws and regulations or amended or newly adopted laws and regulations can be maintained in the future or that future expenditures required to comply with all such laws and regulations in the future will not be material. In the course of implementing our programs to comply with applicable laws and regulations, certain instances of potential non-compliance may be identified from time to time. We cannot predict the outcome of these matters, and cannot estimate a range of reasonably possible losses, if any. This section sets forth the summary of material laws and regulations relevant to our business operations.

Environmental and Occupational Safety and Health Matters

Our operations and the operations of our customers are subject to federal, state and local laws and regulations in the U.S. relating to protection of natural resources and the environment, health and safety aspects of our operations and waste management, including the disposal of waste and other materials. Numerous governmental entities, including the EPA and analogous state agencies, have the power to enforce compliance with these laws and regulations and the permits issued under them, often requiring difficult and costly actions. These laws and regulations may, among other things (i) require the acquisition of permits to take fresh water from surface water and groundwater, construct pipelines or containment facilities, drill wells and other regulated activities; (ii) restrict the types, quantities and concentration of various substances that can be released into the environment or injected into non-producing belowground formations; (iii) limit or prohibit our operations on certain lands lying within wilderness, wetlands and other protected areas; (iv) require remedial measures to mitigate pollution from former and ongoing operations; (v) impose specific safety and health criteria addressing worker protection; and (vi) impose substantial liabilities for pollution resulting from our operations. Any failure on our part or the part of our customers to comply with these laws and regulations could result in the impairment or cancellation of operations, assessment of sanctions, including administrative, civil and criminal penalties, injunctions, reputational damage, the imposition of investigatory, remedial, and corrective action obligations or the incurrence of capital expenditures; the occurrence of restrictions, delays or cancellations in the permitting, development or expansion of projects; and the issuance of injunctions restricting or prohibiting some or all of our activities in a particular area.

The trend in U.S. environmental regulation has recently been to place more restrictions and limitations on activities that may affect the environment, though this has been subject to change over the past decade. Any new laws and regulations, amendment of existing laws and regulations, reinterpretation of legal requirements or increased governmental enforcement that result in more stringent and costly construction, completion or water-management activities, or waste handling, storage transport, disposal, or remediation requirements could have a material adverse effect on our financial position and results of operations. The following is a summary of the more significant existing environmental and occupational safety and health laws in the U.S., as amended from time to time, to which our operations are subject and for which compliance may have a material adverse impact on our capital expenditures, results of operations or financial position.

Hazardous substances and wastes. The RCRA, and comparable state statutes regulate the generation, transportation, treatment, storage, disposal and cleanup of hazardous and non-hazardous wastes. Pursuant to rules issued by the EPA, the individual states administer some or all of the provisions of RCRA, sometimes in conjunction with their own, more stringent requirements. Drilling fluids, produced waters, and most of the other wastes associated with the exploration, development, and production of oil or gas, if properly handled, are currently exempt from regulation as hazardous waste under RCRA, and instead are regulated under RCRA’s less stringent non-hazardous waste provisions, state laws or other federal laws. However, it is

21

Table of Contents

possible that certain oil and gas drilling and production wastes now classified as non-hazardous could be classified as hazardous wastes in the future. Any loss of the RCRA exclusion for drilling fluids, produced waters and related wastes could result in an increase in our and our oil and gas producing customers’ costs to manage and dispose of generated wastes, which could have a material adverse effect on our and our customers’ results of operations and financial position. Effective December 7, 2023, the EPA issued “technical corrections” to RCRA hazardous waste regulations, correcting and clarifying specific provisions promulgated in the Hazardous Waste Generator Improvements rule, the Hazardous Waste Pharmaceuticals rule, and the Definition of Solid Waste rule. States may adopt these rules and may also modify them to become more stringent.

Wastes containing NORM may also be generated in connection with our operations. Certain processes used to produce oil and gas may enhance the radioactivity of NORM, which may be present in oilfield wastes. NORM is subject primarily to individual state radiation control regulations. Texas and New Mexico have both enacted regulations governing the handling, treatment, storage and disposal of NORM. In addition, NORM handling and management activities are governed by regulations promulgated by OSHA. These state and OSHA regulations impose certain requirements concerning worker protection, the treatment, storage and disposal of NORM waste, the management of waste piles, containers and tanks containing NORM, as well as restrictions on the uses of land with NORM contamination.

CERCLA, also known as the Superfund law, and comparable state laws impose liability, without regard to fault or legality of conduct, on classes of persons considered to be responsible for the release of a “hazardous substance” into the environment. These persons include the current and past owner or operator of the site where the hazardous substance release occurred and anyone who disposed or arranged for the disposal of a hazardous substance released at the site. Under CERCLA, such persons may be subject to joint and several, strict liability for the costs of cleaning up the hazardous substances that have been released into the environment, for damages to natural resources and for the costs of certain health studies. CERCLA also authorizes the EPA and, in some instances, third parties to act in response to threats to the public health or the environment and to seek to recover from the responsible classes of persons the costs they incur. In addition, neighboring landowners and other third parties may file claims for personal injury and property damage allegedly caused by the hazardous substances released into the environment. We generate materials in the course of our operations that may be regulated as hazardous substances.

Water discharges and use. The Federal Water Pollution Control Act, also known as the Clean Water Act (“CWA”), and analogous state laws, impose restrictions and strict controls with respect to the discharge of pollutants, including spills and leaks of oil and hazardous substances, into state waters and waters of the U.S. The discharge of pollutants into regulated waters is prohibited, except in accordance with the terms of a permit issued by the EPA or an analogous state agency. Spill Prevention, Control and Countermeasure Plan requirements imposed under the CWA require appropriate containment berms and similar structures to help prevent the contamination of navigable waters in the event of a petroleum hydrocarbon tank spill, rupture or leak. In addition, the CWA and analogous state laws require individual permits or coverage under general permits for discharges of stormwater runoff from certain types of facilities. Federal and state regulatory agencies can impose administrative, civil and criminal penalties for non-compliance with discharge permits or other requirements of the CWA and analogous state laws and regulations.

The CWA also prohibits the discharge of dredge and fill material into regulated waters, including wetlands, unless authorized by permit. In 2015, the EPA and the U.S. Army Corps of Engineers (the “Corps”) under the Obama Administration published a final rule attempting to clarify the federal jurisdictional reach over waters of the U.S. However, the EPA rescinded this rule in 2019 and promulgated the Navigable Waters Protection Rule in 2020. The Navigable Waters Protection Rule defined what waters qualify as navigable waters of the United States under Clean Water Act jurisdiction. This rule was generally viewed as narrowing the scope of waters of the United States as compared to the 2015 rule, and litigation in multiple federal district courts challenged the rescission of the 2015 rule and the promulgation of the Navigable Waters Protection Rule. Then, in June 2021, the Biden Administration announced plans to develop its own definition for such waters, and in August 2021, a federal judge for the U.S. District Court for the District of Arizona issued an order

22

Table of Contents

striking down the Navigable Water Protection Rule. On December 7, 2021, the U.S. Environmental Protection Agency and the Department of the Army (“the agencies”) announced a proposed rule to revise the definition of “waters of the United States” restoring the pre-2015 definition of “waters of the United States,” with updates to reflect consideration of Supreme Court decisions. The public comment period on the proposed rule closed on February 7, 2022. The final revised definition of “waters of the United States” was issued on December 30, 2022. The rule broadened the scope of the “waters of the United States” consistent with the framework of the pre-2015 regulations (also called the 1986 regulations). An expanded scope of the Clean Water Act’s jurisdiction in areas where we conduct operations bears the risk of causing us to incur increased costs and restrictions, delays or cancellations in permitting or projects, which developments could expose us to significant costs and liabilities. However, the Supreme Court’s decision on May 25, 2023 in Sackett v. EPA held that the Clean Water Act extends only to wetlands that have a continuous surface connection with “waters of the United States”- a narrowing (and reversal) of the Ninth Circuit’s interpretation. Further, the Trump administration may seek to return to the water policies advanced during the first Trump administration, focusing on less regulation under the Clean Water Act (including less wetlands protection) and potential repeal of the Biden administration’s “waters of the United States” rules.

Water handling facilities and seismicity. Saltwater disposal via underground injection is regulated pursuant to the UIC program established under the SDWA and analogous state and local laws and regulations. The UIC program includes requirements for permitting, testing, monitoring, recordkeeping and reporting of injection well activities, as well as a prohibition against the migration of fluid containing any contaminant into underground sources of drinking water. State regulations require a permit from the applicable regulatory agencies to operate underground injection wells. Although we monitor the injection process of our wells, any leakage from the subsurface portions of the injection wells could cause degradation of fresh groundwater resources, potentially resulting in suspension of our UIC permit, issuance of fines and penalties from governmental agencies, incurrence of expenditures for remediation of the affected resource and imposition of liability by third parties claiming damages for alternative water supplies, property and personal injuries. A change in UIC disposal well regulations or the inability to obtain permits for new disposal wells in the future may affect our ability to dispose of produced water and other substances, which could affect our business.

Furthermore, in response to seismic events in the past several years near underground disposal wells used for the disposal by injection of produced water resulting from oil and gas activities, federal and some state agencies are investigating whether such wells have caused or contributed to increased seismic activity, and some states have restricted, suspended, or shut down the use of disposal wells within the vicinity of seismic events. In response to these concerns, regulators in some states have imposed, or are considering imposing, additional requirements in the permitting of produced water disposal wells or otherwise to assess any relationship between seismicity and the use of such wells.

We currently operate in the states of New Mexico and Texas, where the NMOCD and the TRC, respectively, have the authority to regulate disposal activity, including the authority to address seismic activity in their respective states. For example, the TRC requires applicants for new disposal wells that will receive non-hazardous produced water or other oil and natural gas waste to conduct seismic activity searches utilizing the U.S. Geological Survey. The searches are intended to determine the potential for earthquakes within a circular area of 100 square miles around a proposed new disposal well. If the permittee or an applicant for a disposal well permit fails to demonstrate that the produced water or other fluids are confined to the disposal zone, or if scientific data indicates such a disposal well is likely to be, or determined to be, contributing to seismic activity, then the TRC may deny, modify, suspend or terminate the permit application or existing operating permit for that disposal well. The TRC has used this authority to deny permits for certain waste disposal wells.

Most recently, in 2021, the NMOCD and TRC created SRAs with action plans to address seismic activity as further discussed below.

23

Table of Contents

New Mexico

The NMOCD has implemented a Seismic Response Protocol, which outlines certain reporting and curtailment requirements for operators in SRAs to follow in response to seismic events based on the magnitude and proximity to the event. The NMOCD created the Hat Mesa SRA in Northern Lea County, New Mexico in response to a seismic event that occurred in that area in the fourth quarter of 2021. The Hat Mesa SRA and associated Seismic Response Protocol resulted in additional reporting requirements, including more frequent reporting with daily injection volume and pressure data for operators within 10 miles of the seismic event, and the reduction of monthly injection volumes for wells within six miles of the seismic event. We operate four wells located within the Hat Mesa SRA that are subject to the protocol. In September 2023, we temporarily curtailed one of these wells in response to a seismic event in Lea County, New Mexico. Due to the uncertainty regarding the causal factors of the event, the NMOCD did not create an SRA nor require the operators of disposal wells within 10 miles of the seismic event to follow the established Seismicity Response Protocol. Therefore, we returned the temporarily curtailed well to pre-curtailment levels beginning on November 1, 2023. As of December 31, 2024, we have partially curtailed injection in one of the wells by approximately 5 kbwpd and continue to operate the partially curtailed well. However, to date we have not had an operational impact on gathering volumes. We are also required to submit daily injection and pressure volumes on a weekly reporting basis. There was no further seismic activity within the Hat Mesa SRA in 2023 or 2024.

Texas

The TRC established the Stanton SRA in 2022. The Stanton SRA is located in Martin County and the western portion of Howard County. Saltwater disposal well operators within the Stanton SRA created a response plan which began on May 15, 2022. The plan employed a two-tiered approach based on the depth of the disposal zone (shallow versus deep disposal wells) and includes expanded data collection efforts, contingency responses for future seismicity, and scheduled checkpoint updates with TRC staff. Following the sale of our assets located in Martin County in 2023, we no longer operate any wells within the Stanton SRA.

The Northern Culberson-Reeves SRA was established in 2021 and expanded in 2022, which expansion partially overlaps with our operations in Northern Culberson, Reeves, and Loving Counties, Texas. However, to date the Northern-Culberson-Reeves SRA has not had a material impact on our operations.

See Part I, Item 1A. Risk Factors ─ Legislation or regulatory initiatives intended to address seismic activity could restrict our ability to recycle or handle produced water gathered from our E&P customers and, accordingly, could have a material adverse effect on our business.

See also Part II, Item 7. Management’s Discussion and Analysis of Results of Operations ─ General Trends and Outlook – Seismicity for a discussion of the impact on our business.

Hydraulic fracturing activities. Hydraulic fracturing involves the injection of water, sand or other proppants and chemical additives under pressure into targeted geological formations to fracture the surrounding rock and stimulate production. Hydraulic fracturing is an important and common practice that is typically regulated by state oil and natural gas commissions or similar agencies. However, the practice continues to be controversial in certain parts of the country, resulting in increased scrutiny and regulation of the hydraulic fracturing process, including by federal agencies that have asserted regulatory authority or pursued investigations over certain aspects of the hydraulic fracturing process. For example, the EPA has asserted regulatory authority pursuant to the SDWA UIC program over hydraulic fracturing activities involving the use of diesel and issued guidance covering such activities, as well as published an Advanced Notice of Proposed Rulemaking regarding TSCA reporting of the chemical substances and mixtures used in hydraulic fracturing.

Various policy makers, regulatory agencies and political candidates at the federal, state and local levels have proposed restrictions on hydraulic fracturing, including its outright prohibition. Some state and local governments have adopted, and other governmental entities are considering adopting, regulations that could

24

Table of Contents

impose more stringent permitting, disclosure and well-construction requirements on hydraulic fracturing operations, including states where we or our customers operate. In recent years, for example, various bills have been introduced in the New Mexico Senate to place a moratorium on hydraulic fracturing, and in 2024, a ban on hydraulic fracturing came into effect in California, following a years-long moratorium.

In the event that new federal, state or local restrictions or bans on the hydraulic fracturing process are adopted in areas where we or our customers conduct business, we or our customers may incur additional costs or permitting requirements to comply with such requirements that may be significant in nature and our customers could experience added restrictions, delays or cancellations in their exploration, development, or production activities, which would in turn reduce the demand for our services and have a material adverse effect on our liquidity, consolidated results of operations, and consolidated financial condition. However, it is possible that, under the second Trump administration, hydraulic fracturing will increase, particularly on federal lands.

Air Emissions. The CAA and comparable state laws restrict the emission of air pollutants from many sources through air emissions standards, construction and operating permit programs and the imposition of other compliance standards. These laws and regulations may require us to obtain pre-approval for the construction or modification of certain projects or facilities expected to produce or significantly increase air emissions, obtain and strictly comply with stringent air permit requirements or utilize specific equipment or technologies to control emissions of certain pollutants. The need to obtain permits has the potential to delay our projects as well as our customers’ development of oil and gas projects. Over the next several years, we or our customers may incur certain capital expenditures for air pollution control equipment or other air emissions-related issues. For example, in 2015, the EPA issued a final rule under the CAA, lowering the NAAQS for ground-level ozone from the current standard of 75 parts per million to 70 parts per million under both the primary and secondary standards to provide requisite protection of public health and welfare, respectively. Since that time, the EPA has issued area designations with respect to ground-level ozone and final requirements that apply to state, local, and tribal air agencies for implementing the 2015 NAAQS for ground-level ozone, which the EPA reaffirmed in 2020.

Climate Change. Numerous regulatory initiatives related to climate change have been enacted, and are likely to continue to be developed, at the international, national, regional and state levels of government to monitor and limit existing emissions of GHGs as well as to restrict or eliminate such future emissions. At the federal level, in December 2009, the EPA determined that emissions of carbon dioxide, methane and other GHGs endanger public health and the environment because emissions of such gases are, according to the EPA, contributing to warming of the Earth’s atmosphere and other climatic changes. Based on these findings, the EPA began adopting and implementing regulations to restrict emissions of GHGs under existing provisions of the CAA. In November 2021, the EPA also proposed New Source Performance Standards updates and emission guidelines to reduce methane and other pollutants from the oil and gas industry.

During the Biden administration, the President and the Democratic Party identified climate change as a priority. The Biden Administration, for example, reentered the United States into the Paris Agreement in February 2021. In addition, the Biden Administration issued multiple executive orders pertaining to environmental regulations and climate change, including the Executive Order on Protecting Public Health and the Environment and Restoring Science to Tackle the Climate Crisis and Executive Order on Tackling the Climate Crisis at Home and Abroad. In the latter executive order, President Biden established climate change as a primary foreign policy and national security consideration, affirmed that achieving net-zero GHG emissions by or before midcentury is a critical priority, affirmed the Biden Administration’s desire to establish the United States as a leader in addressing climate change, generally further integrated climate change and environmental justice considerations into government agencies’ decision-making, and eliminated fossil fuel subsidies, among other measures. Under the Paris Agreement, the Biden Administration committed the United States to reducing its GHG emissions by 50-52% from 2005 levels by 2030. In November 2021, the United States and other countries entered into the Glasgow Climate Pact, which includes a range of measures designed to address climate change, including but not limited to the phase-out of fossil fuel subsidies, reducing methane emissions 30% by 2030, and cooperating toward the advancement of the

25

Table of Contents

development of clean energy. In August 2022, the Inflation Reduction Act of 2022 was enacted and included a $369 billion investment in modernizing the American energy system. The legislation is aimed at helping the United States achieve the 50-52% reduction of GHGs from 2005 levels by 2030. In December 2022, the EPA issued a supplemental proposal to update, strengthen, and expand the standards proposed in November 2021 and further reduce methane and volatile organic compound emissions from oil and natural gas facilities. In May 2023, the EPA proposed revised new source performance standards under Clean Air Act section 111(b) for GHG emissions from certain sources.

While Congress has from time to time considered legislation to reduce emissions of GHGs, there has not been significant new activity in the form of adopted legislation to reduce emissions of GHGs in recent years. Instead, the federal government has worked through agencies, such as the EPA, to target and reduce GHG emissions through regulations and standards, and many states (and their state level environmental agencies) have established rules aimed at reducing or tracking GHG emissions. In January 2019, New Mexico’s governor signed an executive order declaring that New Mexico would support the goals of the Paris Agreement by joining the U.S. Climate Alliance, a bipartisan coalition of governors committed to reducing GHG emissions consistent with the goals of the Paris Agreement. The stated objective of the executive order is to achieve a statewide reduction in GHG emissions of at least 45% by 2030 as compared to 2005 levels. The executive order also requires New Mexico regulatory agencies to create an “enforceable regulatory framework” to ensure methane emission reductions. Pursuant to that executive order, in 2020, the New Mexico Oil Conservation Division and New Mexico Environment Department proposed certain rules regarding the reduction of natural gas waste and the control of emissions. The final rule, known as the Ozone Precursor Rule, was published on July 26, 2022 and became effective on August 5, 2022. It is more protective than current federal requirements. The New Mexico Ozone Precursor Rule includes, among other things, requirements that upstream and midstream operators reduce natural gas waste by a fixed amount each year and achieve a reduction in ozone precursor pollutants (volatile organic compounds and oxides of nitrogen) of approximately 260 million pounds annually. The Ozone Precursor Rule contains requirements applicable to produced water management units (“PWMUs”) (defined to include recycling facilities, permanent pits, and ponds designed to accumulated produced water—the incidental byproduct of well completion and oil and gas production—with storage capacity of at least 50,000 barrels), such as emissions standards, monitoring requirements, and recordkeeping requirements. Similar efforts have been made in the New Mexico state legislature, including introduction in January 2022 of the Clean Future Act to establish GHG emissions limits; the Clean Future Act was postponed indefinitely in committee.

Many states have also established or begun participating in GHG cap and trade programs. Most of these cap and trade programs work by requiring major sources of emissions, such as electric power plants, or major producers of fuels, such as refineries and natural gas processing plants, to acquire and surrender emission allowances. The number of allowances available for purchase is reduced each year in an effort to achieve the overall GHG emission reduction goal.

In January 2025, the Trump Administration issued executive orders seeking to curb or rollback many of these climate change initiatives and increase support for domestic fossil fuels, including to withdraw the United States from the Paris Agreement, pause regulatory rulemaking, rescind multiple Biden Administration executive orders on climate initiatives, halt funding pursuant to the Inflation Reduction Act and Infrastructure Investment and Jobs Act and revisit prior guidance related to the authority of the EPA.

Endangered Species. The ESA restricts activities that may affect endangered or threatened species or their habitats. Similar protections are offered to migratory birds under the federal MBTA and BGEPA. To the degree that species listed under the ESA or similar state laws, or are protected under the MBTA or BGEPA, live in the areas where we or our oil and gas producing customers operate, our and our customers’ abilities to conduct or expand operations and construct facilities could be limited or be forced to incur material additional costs. Moreover, our customers’ drilling activities may be delayed, restricted, or cancelled in protected habitat areas or during certain seasons, such as breeding and nesting seasons. Some of our operations and the operations of our customers are located in areas that are designated as habitats for protected species. In addition, the USFWS may make determinations on the listing of unlisted species as endangered or

26

Table of Contents

threatened under the ESA. The USFWS declared the southern population of the lesser prairie-chicken as an endangered species on November 25, 2022. We entered into the voluntary Candidate Conservation Agreement (“CCAA”) in January 2023. By voluntarily participating in the CCAA, our ongoing oil and gas activities have greater flexibility in project development in the lesser-prairie chicken range and we avoid a lengthy project consultation on each new project between the BLM and USFWS. The designation of previously unidentified endangered or threatened species could indirectly cause us to incur additional costs, cause our or our oil and gas producing customers’ operations to become subject to operating restrictions or bans and limit future development activity in affected areas. For example, in May 2024, the dunes sagebrush lizard native to southeast New Mexico and west Texas was listed as endangered, a move sparking allegations that the designation occurred to hinder fossil fuel production. This resulted in a federal lawsuit filed in the Western District of Texas aimed at overturning the designation. Further, the USFWS and similar state agencies may designate critical or suitable habitat areas that they believe are necessary for the survival of threatened or endangered species. Such a designation could materially restrict use of or access to federal, state, and private lands.

Chemical Safety. We are subject to a wide array of laws and regulations governing chemicals, including the regulation of chemical substances and inventories, such as TSCA in the U.S. These laws and regulations change frequently and have the potential to limit or ban altogether the types of chemicals we may use in our products, as well as result in increased costs related to testing, storing, and transporting our products prior to providing them to our customers. For example, in 2016, President Obama signed into law the Frank R. Lautenberg Chemical Safety for the 21st Century Act (the “Lautenberg Act”), which substantially revised TSCA. Among other items, the Lautenberg Act eliminated the cost-benefit approach to analyzing chemical safety concerns with a health-based safety standard and requires all chemicals in commerce, including those “grandfathered” under TSCA, to undergo a safety review. The Lautenberg Act also requires safety findings before a new chemical can enter the market. The EPA, charged with implementing the Lautenberg Act, has the ability to interpret new provisions of the Lautenberg Act in ways that cannot be predicted, and it is always possible that new legislation or new regulations may be adopted pursuant to these regulatory and legislative efforts, which could impact our business, such as: any new restrictions on the development of new products; increases in regulation; and disclosure of confidential, competitive information.

Furthermore, governmental, regulatory and societal demands for increasing levels of product safety and environmental protection could result in increased pressure for more stringent regulatory control with respect to the chemical industry. These concerns could influence public perceptions regarding our products and operations, the viability of certain products, our reputation, the cost to comply with regulations, and the ability to attract and retain employees. Moreover, changes in environmental, health and safety regulations could inhibit or interrupt our operations, or require us to modify our facilities or operations. Accordingly, environmental or regulatory matters may cause us to incur significant unanticipated losses, costs or liabilities, which could reduce our profitability.

Occupational Safety and Health and other legal requirements. We are subject to the requirements of the federal Occupational Safety and Health Act and comparable state statutes whose purpose is to protect the health and safety of workers. In addition, the OSHA’s hazard communication standard, the EPA’s Emergency Planning and Community Right-to-Know Act and comparable state regulations and any implementing regulations require that we organize and/or disclose information about hazardous materials used or produced in our operations and that this information be provided to employees, state and local governmental authorities and citizens. We have an internal program of inspection designed to monitor and enforce compliance with worker safety requirements.

Item 1A. Risk Factors

Described below are certain risks that we believe are applicable to our business. The risks described below are not the only ones that we face. Additional risks not presently known to us or that we currently deem immaterial individually or in the aggregate may also impair our business operations. This information should be considered carefully, together with other information in this report and other reports and materials we file

27

Table of Contents

with the SEC. If any of these risks were to occur, our business, financial condition, results of operations or liquidity and the trading price of our Class A common stock could be materially adversely affected.

Risks Related to Our Business

Our business depends on capital spending by the oil and gas industry in the Permian Basin and reductions in capital spending could have a material adverse effect on our liquidity, results of operations and financial condition.

Demand for our services is directly affected by capital spending by our customers to explore for, develop and produce oil and gas in the Permian Basin. Our produced water handling revenues are substantially dependent upon oil, natural gas and NGL production from our customers’ upstream activity. Our Water Solutions revenues are substantially dependent upon the number of wells drilled and completed by our customers and the amount of water used in completing each well. In addition, there is a natural decline in production from existing wells that are connected to our gathering systems. We have no control over the amount of resources that our customers devote to the development of oil and gas reserves.

Industry conditions that affect capital spending are influenced by numerous factors over which we have no control, including, among other things:

domestic and foreign political and economic conditions and supply of and demand for oil and gas;
the level of prices, and expectations regarding future prices, of oil and gas;
the level of global oil and gas exploration and production and storage capacity;
actions by the members of OPEC+ with respect to oil production levels and announcements of potential changes in such levels, including the ability of the OPEC+ countries to agree on and comply with supply limitations;
preferences of the oil and gas investment community to prioritize dividends and share repurchases over production growth;
consolidation in the oil and gas industry, which may result in lower overall drilling and completion activity;
governmental regulations, including environmental restrictions and the policies of governments regarding the exploration for and production and development of their oil and gas reserves;
releases from strategic oil reserves;
supply chain disruptions or constraints;
governmental laws, policies, regulations, subsidies and other actions to promote or discourage the use of renewable energy sources;
federal and state regulators responses to seismicity;
taxation and royalty charges;
global weather conditions, pandemics and natural disasters;

28

Table of Contents

armed conflict, terrorist attacks and worldwide political, military and economic events, including the Russia-Ukraine and Middle Eastern conflicts and any related political or economic responses;
trade policy of domestic and foreign governments, including the imposition of tariffs or other levies on cross-border movement of goods and services;
the cost of producing and delivering oil and gas;
the discovery rates of new oil and gas reserves and the availability of commercially viable geographic areas in which to explore and produce crude oil and natural gas;
activities by non-governmental organizations to limit certain sources of funding for the energy sector or restrict the exploration, development and production of oil and gas;
the ability of oil and gas producers to access capital;
technical advances affecting production efficiencies and overall energy consumption; and
the potential acceleration of the development of alternative fuels.

Prior adverse changes in the global economic environment and capital markets and declines in prices for crude oil and natural gas have caused many customers to reduce capital budgets for future periods and have caused decreased demand for crude oil and natural gas. Limitations on the availability of capital, or higher costs of capital, for financing expenditures have caused and may continue to cause customers to make additional reductions to capital budgets in the future even if commodity prices increase from current levels. If oil and gas prices decline, our customers may further reduce their exploration, development and production activities and demand lower rates for our services or delay, modify, or terminate their use of our services. If our customers fail to maintain or increase their capital spending and demand for our services, it could have a material adverse effect on our liquidity, results of operations and financial condition.

If oil prices or natural gas prices remain volatile or were to decline, the demand for our services could be adversely affected.

The volume of water we process is driven in large part by the level of crude oil production, which is primarily determined by current and anticipated oil and natural gas prices and demand and the related levels of capital spending and drilling activity in the areas in which we have operations. Volatility or weakness in oil prices or natural gas prices (or the perception that oil prices or natural gas prices will decrease), oil and gas investor expectations and other factors beyond our control affect the spending patterns of our customers and may result in the drilling or completion of fewer new wells or lower production spending on existing wells. This, in turn, could lead to lower demand for our services and may cause lower rates and lower utilization of our assets. Prices for oil and natural gas historically have been extremely volatile and are expected to continue to be volatile. During the year ended December 31, 2024, the average WTI spot price was $76.63 versus an average price of $77.58 for the year ended December 31, 2023. If oil prices or natural gas prices decline, or if completions activity is reduced, the demand for our services and our results of operations could be materially and adversely affected. Even in an environment of stronger oil and gas prices, fewer oil and gas completions in our market areas as a result of decreased capital spending may have a negative long-term impact on our business. In addition, certain of our contracts, including a contract with one of our significant customers, provide for rates that periodically fluctuate within a defined range in response to changes in the WTI price; therefore, a portion of our revenue is directly exposed to fluctuations in the price of crude oil.

Additionally, as part of our water processing activities, we aggregate and sell recovered crude oil, also known as skim oil. A portion of our cash flow from operations is dependent on skim oil sales revenue, which is

29

Table of Contents

directly exposed to fluctuations in the price of crude oil. Fluctuations and decreases in production volume or the price that we receive for skim oil could impact our liquidity, results of operations or financial condition.

The fees charged to customers under our agreements for the gathering, transportation or handling of produced water may not escalate sufficiently to cover increases in costs and the agreements may be suspended in some circumstances, which would affect our profitability.

Our costs may increase more rapidly than the fees that we charge to customers pursuant to our contracts with them. If inflation and other cost increases, such as the cost for labor, chemical treatment, rental equipment and fuel expenses, outpace the fees we charge to customers, as they have from time to time during recent periods, our profit margins will be reduced. Additionally, some customers’ obligations under their agreements with us may be permanently or temporarily reduced upon the occurrence of certain events, some of which are beyond our control, including force majeure events wherein the supply of produced water is curtailed or cut off. Force majeure events generally include (but are not limited to) revolutions, wars, acts of enemies, embargoes, import or export restrictions, strikes, lockouts, fires, storms, floods, acts of God, explosions, mechanical or physical failures of our equipment or facilities of our customers. If the escalation of fees is insufficient to cover increased costs, or if any customer suspends or terminates its contracts with us, our profitability could be materially affected.

We operate in a highly competitive industry, which may intensify if our competitors expand their water supply, produced water recycling, and produced water handling operations or customers elect to operate their water-management services in-house or enter into arrangements with other oil and gas producers for water-management services rather than outsource these services to companies like us, thereby causing us to lose market share, which could, in turn, negatively affect our ability to expand our operations.

The Produced Water Handling and Water Solutions businesses are highly competitive and include numerous companies capable of competing effectively in our markets on a local basis. In our Water Solutions business, we compete with landowners, water supply and transfer companies, and companies who engage in the sale or treatment of produced water. Our Produced Water Handling business is in direct and indirect competition with other businesses, including water handling and other produced water treatment businesses. Some of our larger diversified competitors have a broad geographic scope, as well as greater financial and other resources than us, while others focus on specific basins only and may have locally competitive cost efficiencies as a result.

Additionally, there may be new companies that enter the water solutions business, or our existing and potential customers may develop their own water management solutions. Our ability to maintain current revenue and cash flows, and our ability to expand our operations, could be adversely affected by the activities of our competitors and our customers. If our competitors substantially increase the resources they devote to the development and marketing of competitive services or substantially decrease the prices at which they offer their services, we may be unable to effectively compete. If our existing and potential customers choose to operate their water-management services in-house or enter into arrangements with other oil and gas producers for water-management services rather than outsource these services to companies like us, including by developing their own water handling or solutions businesses, we may not be able to effectively replace that revenue. In addition, several of our long-term contracts for our Produced Water Handling business are up for renewal in the next few years. Our inability to renew these contracts at or above current pricing, or at all, could negatively impact our business. All of these competitive pressures could have a material adverse effect on our business, results of operations and financial condition.

30

Table of Contents

Our Produced Water Handling business depends upon available pore space in subsurface geologic formations by which we can dispose of produced water through underground injection wells. Our inability to acquire new pore space or our loss of existing pore space may negatively impact our ability to service new and existing customers.

We dispose of produced water generated by our customers during oil and gas operations by drilling disposal wells and injecting such produced water into porous subsurface geologic formations. The amount of subsurface pore space that is capable of permanently storing injected produced water is finite and requires constant replenishment. As we continue to inject produced water into our existing produced water disposal wells, we may exhaust the geologic or technical limits of the subsurface strata for produced water injection. Furthermore, state regulatory bodies in Texas and New Mexico, which have permitting authority over disposal wells, have imposed new requirements in the permitting of produced water disposal wells to assess any relationship between induced seismicity and the use of such wells. State regulators may deny, modify, suspend or terminate permits on grounds that a disposal well is likely to be, or determined to be, causing seismic activity or would be operating at impermissible pressure levels. States have also issued, and may in the future issue, orders to temporarily shut down or to curtail the injection depth, injection capacity or injection rate of existing wells because of concerns over induced seismicity.

Any loss of pore space or injection capacity for technical, geological or regulatory reasons could require us to spend significant time and capital expenditure to locate, apply for, permit, drill, complete and place into service new disposal wells and to build pipeline infrastructure to transport produced water to such new wells. Our customers’ oil and gas production growth plans may also require us to secure additional pore space and disposal wells and build new pipeline infrastructure. Permits for new disposal wells could be challenged for a variety of reasons by our competitors, oil and gas producers, landowners or non-governmental organizations. Such regulatory challenges could be successful and prevent us from being able to secure additional disposal capacity. New disposal wells may also subject us to higher royalty rates. Furthermore, we may not have contractual or real property rights to dispose of produced water at locations that are in geographic proximity to our customers’ existing or new oil and gas production wells or our existing injection wells and pipeline infrastructure. In such cases, we would be required to spend significant amounts of capital to build new pipeline infrastructure to transport produced water to distant disposal locations.

If we are unable to accept all of the produced water delivered to us by our customers because we lack available pore space for underground injection, we could be subject to contractual penalties for alternative disposal solutions, including trucking, and such penalties could be significant. Any curtailment of our customers’ oil and gas production due to a lack of available pore space or injection capacity would result in lost revenue to us and could trigger contractual termination rights. Any of these events, either individually or in aggregate, could result in a material adverse effect on our business, results of operation and financial condition.

Growing or adapting our business by constructing new transportation systems and facilities subjects us to construction risks and risks that supplies for such systems and facilities will not be available upon completion thereof.

One of the ways we intend to grow our business is through the construction of expansions to our existing systems and facilities and/or the construction of new systems and facilities, such as produced water pipelines, produced water injection wells, treatment facilities, water handling facilities and other infrastructure. These projects and any similar projects that we are obligated to undertake to support existing customers’ operations require the expenditure of significant amounts of capital, which may exceed our resources, and involve numerous regulatory, environmental, political and legal uncertainties, including political opposition by landowners, environmental activists and others. There can be no assurance that we will complete these projects on schedule, or at all, or at the budgeted cost. We could also encounter technical difficulties during the drilling of a disposal well leading to a reduction in capacity or a shorter useful life. Our revenues may not increase upon the expenditure of funds on a particular project. Moreover, we may undertake these projects to capture anticipated future growth in production in a region in which anticipated production growth does not

31

Table of Contents

materialize or for which we are unable to acquire new customers. As a result, our new facilities and infrastructure may not be able to attract enough demand for our services to achieve our expected investment return, which could materially and adversely affect our results of operations and financial position. In addition, we may also deem it necessary to construct new wells and related pipelines so as to ensure the desired or required amount of spacing between wells. This can require substantial costs, delays in growth of operations, or risks of entering new areas.

We face opposition to the development or operation of our water pipelines, injection wells and facilities from various individuals and groups.

We have experienced opposition to the development or operation of our water pipelines, injection wells and facilities from our competitors, oil and gas producers, landowners and other third parties and may in the future face opposition from various individuals or groups such as government officials, environmental groups, tribal groups, local groups and other advocates. Such opposition can take many forms, including the delay or denial of required governmental permits, organized protests, attempts to block or sabotage our operations, intervention in regulatory or administrative proceedings related to our permitting efforts or otherwise involving our assets, or lawsuits or other actions designed to prevent, disrupt or delay the operation of our assets and business. For example, repairing our pipelines often involves securing consent from individual landowners to access their property and provide us with sufficient temporary space to allow us to conduct repairs. One or more landowners may resist our efforts to make needed repairs, which could lead to an interruption in the operation of the affected pipeline or facility for a period of time that is significantly longer than would have otherwise been the case. In addition, acts of sabotage or eco-terrorism could cause significant damage or injury to people, property or the environment or lead to extended interruptions of our operations. Moreover, governmental authorities exercise considerable discretion in the timing and scope of permit issuance and the public may engage in the permitting process, including through intervention in the courts. Negative public perception could cause the permits we require to conduct our operations to be withheld, delayed or burdened by requirements that restrict our ability to profitably conduct our business. Any such event that delays or otherwise interrupts the revenues generated by our operations, or which causes us to make significant expenditures not covered by insurance, could adversely affect our results of operations and financial condition.

There is uncertainty related to the future of the oil and natural gas industry broadly.

Although we are not directly engaged in the extraction of oil and natural gas, produced water is a natural byproduct of crude oil and natural gas production so efforts in recent years in the investment community to reduce access to capital markets and pressure lenders to limit funding or increase the cost of lending to companies engaged in the extraction of oil and natural gas may adversely affect our business and limit our access to capital. The negative sentiment toward the oil and natural gas industry compared to other industries has led to lower oil and gas representation in certain key equity market indices. Some investors, including certain pension funds, university endowments and family foundations, have stated policies to reduce or eliminate their investments in the oil and gas sector based on social and environmental considerations. Many political and regulatory authorities, along with certain financing sources and well-funded environmental activist groups, are devoting substantial resources and efforts to minimize or eliminate the use of oil and natural gas as a source of energy, domestically and internationally, which could reduce the demand and pricing for ancillary services, including our services, interfere with our customers’ business activities and operations, and potentially materially and adversely impact our future financial results, liquidity, ability to raise capital and growth prospects.

Concerns about the environmental impacts of the oil and natural gas industry, including impacts on global climate, have resulted in certain increased regulation and standards aimed at reducing GHG emissions, unfavorable lending policies toward the financing of oil and natural gas operations and divestment efforts affecting the industry and the investment community, and any such event in the future could adversely affect demand for our services. Certain members of the investment community increased their focus on ESG practices and disclosures, including practices and disclosures related to GHGs and climate change in the

32

Table of Contents

energy industry in particular. As a result, we may face pressure regarding our ESG practices and disclosures from these and other stakeholders (who may or may not agree with our practices or disclosures). We have announced, and may announce in the future, various sustainability or other ESG related commitments, goals or targets that are ambitious and we may be unable to meet such commitments, goals or targets in the manner or on the timeline as initially contemplated, which could expose us to investor scrutiny, government enforcement actions and private litigation. Regardless of our reporting regime or content, certain investors and organizations may publish ratings or views on our sustainability or other ESG efforts or disclosures that are not favorable. This could limit our access to capital, impair our ability to attract talent, and have an adverse impact on our business.

In addition, increasing attention to the risks of climate change has resulted in an increased possibility of lawsuits brought by public and private entities against oil and natural gas operators. If any of our customers are targeted by any such litigation and incur liability, which, to the extent that societal pressures or political or other factors are involved, could be imposed without regard to our causation of or contribution to the asserted damage or to other mitigating factors, demand for our services could be adversely affected.

The ability to attract and retain key members of management, other key personnel and qualified Board members is critical to the success of our business.

Our success depends to a large extent upon the efforts and abilities of our senior management team and other key personnel and the experience and knowledge of our Board members. The ability to attract and retain these key personnel may be difficult in light of the volatility of our business. Acquiring and keeping personnel could prove more difficult or cost substantially more than estimated. These factors could cause us to incur greater costs or prevent us from pursuing our business strategy as quickly as we would otherwise wish to do. If executives or other key personnel resign, retire or are terminated, or their service is otherwise interrupted, we may not be able to replace them adequately or in a timely manner and we could experience significant declines in productivity.

We may have difficulty securing sufficient labor to meet our needs.

We are dependent upon the available labor pool of skilled employees and may not be able to find enough labor to meet our needs, which could have a negative effect on our growth. We are also subject to the Fair Labor Standards Act, which governs such matters as minimum wage, overtime and other working conditions. Our services require skilled workers who can perform physically demanding work. As a result of our industry volatility, pronounced declines in drilling and completions activity, as well as the demanding nature of the work, many workers have left the oilfield services sector to pursue employment in different fields. If we are unable to retain or meet the growing demand for skilled technical personnel, our operating results and our ability to execute our growth strategies may be adversely affected.

The growth of our business through acquisitions may expose us to various risks, including those relating to difficulties in identifying suitable, accretive acquisition opportunities and integrating businesses, assets and personnel, as well as difficulties in obtaining financing for targeted acquisitions and the potential for increased leverage or debt service requirements.

As a component of our business strategy, we pursue acquisitions of assets, businesses and technologies. Acquisitions involve numerous risks, including:

unanticipated costs and assumption of liabilities and exposure to unforeseen liabilities of the acquired business, including but not limited to environmental liabilities;
difficulties assessing the future magnitude or potential impact of identified liabilities;
difficulties in integrating the operations and assets of the acquired business and the acquired personnel;

33

Table of Contents

limitations on our ability to properly assess and maintain an effective internal control environment over an acquired business;
potential losses of key employees and customers of the acquired business;
risks of entering markets in which we have limited prior experience; and
increases in our expenses and working capital requirements.

In evaluating acquisitions, we generally prepare one or more financial cases based on a number of business, industry, economic, legal, regulatory and other assumptions applicable to the proposed transaction. Although we expect a reasonable basis will exist for those assumptions, the assumptions will generally involve current estimates of future conditions. Realization of many of the assumptions will be beyond our control. Future commercial opportunities may need to develop with respect to an acquisition in order for us to realize the expected benefits from such acquisition. Moreover, the uncertainty and risk of inaccuracy associated with any financial projection will increase with the length of the forecasted period. Some acquisitions may not be accretive in the near term and will be accretive in the long-term only if we are able to timely and effectively integrate the underlying assets and such assets perform at or near the levels anticipated in our acquisition projections.

The process of integrating an acquired business may involve unforeseen costs and delays or other operational, technical, regulatory, legal and financial difficulties and may require a significant amount of time and resources. Our failure to successfully incorporate the acquired business and assets into our existing operations or to minimize any unforeseen operational, technical, regulatory, legal or financial difficulties could have a material adverse effect on our financial condition and results of operations. Furthermore, there is intense competition for acquisition opportunities in our industry. Competition for acquisitions may increase the cost of, or cause us to refrain from, completing acquisitions.

In addition, we may not have sufficient capital resources to complete acquisitions. We may incur substantial indebtedness to finance future acquisitions and also may issue equity, debt or convertible securities in connection with such acquisitions. Debt service requirements could represent a significant burden on our results of operations and financial condition and the issuance of additional equity or convertible securities could be dilutive to our existing equity holders. Furthermore, we may not be able to obtain additional financing on satisfactory terms. Even if we have access to the necessary capital, we may be unable to continue to identify suitable acquisition opportunities, negotiate acceptable terms or successfully acquire identified targets.

Our operations are subject to inherent risks in the oil and gas industry, some of which are beyond our control. These risks may be self-insured, or may not be fully covered under our insurance policies.

Our operations are subject to hazards inherent in the oil and gas industry, such as, but not limited to, accidents and releases of produced water into the environment. These conditions can cause:

disruption in operations;
substantial repair, workover or remediation costs;
technical difficulties encountered during disposal well drilling activities that require significant incremental capital expenditure or that render the well unfit for future service;
personal injury or loss of human life;
significant damage to or destruction of property, plant and equipment;

34

Table of Contents

environmental pollution, including groundwater contamination;
impairment or suspension of operations; and
substantial revenue loss.

The occurrence of a significant event or adverse claim in excess of the insurance coverage that we maintain or that is not covered by insurance could have a material adverse effect on our liquidity, results of operations and financial condition. Any interruption in our services due to pipeline breakdowns or necessary maintenance, workovers or repairs to our wells or other facilities could reduce our revenues and earnings. Variability of maintenance, workover or repair expense could have a significant negative impact on our gross margin and earnings. In addition, the hazards and risks associated with the transport, storage, handling, treatment and disposal of produced water has and may continue to expose us to claims from our employees, customers, and third parties, including, but not limited to, personal injury claims, property damage claims (including claims related to reservoir damage or subsurface trespass) and/or environmental liability claims. Litigation arising from a significant or catastrophic occurrence at a location where our equipment and services are being used may result in our being named as a defendant in lawsuits asserting large claims for which we may not be adequately indemnified or for which we have agreed to indemnify a customer or other third-party. Due to the unpredictable nature of such events and litigation, it is not possible to predict their impact on our results or the ultimate outcome of any current or future claims or lawsuits with certainty, and we may be held liable for significant losses.

We do not have insurance against all foreseeable risks, either because insurance is not available or because of the high premium costs. The occurrence of an event not fully insured against or the failure of an insurer to meet its insurance obligations could result in substantial losses. In addition, we may not be able to maintain adequate insurance in the future at rates we consider reasonable. Insurance may not be available to cover any or all of the risks to which we are subject, or, even if available, it may be inadequate, or insurance premiums or other costs could rise significantly in the future so as to make such insurance prohibitively expensive. Insurance may be inadequate in circumstances where, among others, we are unable to enforce the contractual allocation of potential liability and risks in our agreements with third-parties, where we incur an unforeseen liability falling outside the scope of such allocation or where we are required to enter into agreements in which such allocation is otherwise unfavorable to us. As a result, we may incur substantial losses which could materially and adversely affect our financial condition and results of operations.

A loss of one or more significant customers could materially or adversely affect our results of operations.

We expect to continue to depend on a limited number of key customers to support our revenues for the foreseeable future. Any development that materially and adversely affects these customers could result in a reduction in our customers’ spending for our services. Our two largest customers for the year ended December 31, 2024 represented approximately 53% of our revenues. The loss of key customers, failure to renew contracts upon expiration, or a sustained decrease in demand by one or more key customers could result in a substantial loss of revenues and could have a material and adverse effect on our results of operations.

Because a significant portion of our revenues is derived from ConocoPhillips and Chevron U.S.A. Inc., any development that materially and adversely affects ConocoPhillips’ and Chevron U.S.A. Inc.’s operations, financial condition or market reputation could have a material adverse impact on us.

ConocoPhillips is our largest customer, is a significant shareholder in us and is expected to play a significant role in our success. Accordingly, we are indirectly subject to the business risks of ConocoPhillips. Because a significant portion of our revenues is derived from ConocoPhillips and Chevron U.S.A. Inc., any development that materially and adversely affects ConocoPhillips’ and Chevron U.S.A. Inc.’s operations, financial condition or market reputation could have a material adverse impact on us. For the year ended December 31, 2024,

35

Table of Contents

ConocoPhillips and its affiliates and Chevron U.S.A. Inc. accounted for approximately 32% and 21% of our total consolidated revenues, respectively. As of December 31, 2024, ConocoPhillips and its affiliates and Chevron U.S.A. Inc. accounted for approximately 16% and 34% of our accounts receivable.

Our lack of diversification increases the risk of an investment in us and we are vulnerable to risks associated with operating primarily in one geographic area.

All of our operations are in the Permian Basin in Texas and New Mexico, making us vulnerable to risks associated with operating in one geographic area. Due to the concentrated nature of our business activities, a number of our properties could experience any of the same conditions at the same time, resulting in a relatively greater impact on our results of operations than they might have on other companies that are more diversified. In particular, we may be disproportionately exposed to the impact of regional supply and demand factors, availability of equipment, facilities, personnel or services, significant governmental regulation, natural disasters, adverse weather conditions, water shortages or other drought related conditions. Such delays or interruptions could have a material adverse effect on our financial condition, results of operations and cash flows.

Seasonal weather conditions and natural or man-made disasters could severely disrupt normal operations and have an adverse effect on our business, financial position and results of operations.

We operate in the Permian Basin which may be adversely affected by seasonal weather conditions and natural or man-made disasters. During periods of heavy snow, ice, rain or extreme weather conditions such as high winds and tornados or after other natural disasters such as earthquakes or wildfires, we may be unable to access our assets and our facilities may be damaged or our customers may choose to curtail volumes, thereby reducing our ability to provide services and generate revenues. For example, numerous earthquakes have been recorded recently in West Texas and Southeastern New Mexico. In addition, hurricanes or other severe weather in areas where we do not operate, such as the Gulf Coast region (including those weather-related events which may be caused or exacerbated by climate change), could seriously disrupt the supply of products and cause serious shortages in various areas, including the areas in which we do operate. Such disruptions could potentially have a material adverse impact on our business, consolidated financial position, results of operations and cash flows.

We engage in transactions with related parties and such transactions present possible conflicts of interest that could have an adverse effect on us.

We have historically entered into a number of transactions with related parties. In particular, we have entered into a water gathering and handling agreement with ConocoPhillips, which owned approximately 47% of our Class B common stock and a 22% interest in Solaris LLC (representing approximately 22% of our combined economic interest and voting power), as of December 31, 2024. In addition, a member of our Board of Directors is affiliated with ConocoPhillips. Related party transactions create the possibility of conflicts of interest with regard to our management. Such a conflict could cause an individual in our management to seek to advance his or her economic interests above ours. Further, the appearance of conflicts of interest created by related party transactions could impair the confidence of our investors. It is possible that a conflict of interest could have a material adverse effect on our liquidity, results of operations and financial condition.

Defaults by customers and counterparties could adversely affect our business, financial condition, and results of operations. 

The deterioration in the financial condition of one or more of our significant customers or counterparties could result in their failure to perform under the terms of their agreement with us or default in the payment owed to us. Our customers and counterparties include crude oil and natural gas producers, equipment suppliers and groundwater suppliers whose creditworthiness may be suddenly and disparately impacted by, among other factors, commodity price volatility, deteriorating energy market conditions, and public and regulatory opposition to energy producing activities. While we have credit approval procedures and policies in place, we

36

Table of Contents

are unable to completely eliminate the performance and credit risk to us associated with doing business with these parties. In a low commodity price environment, certain of our customers have been or could be negatively impacted, causing them significant economic stress resulting, in some cases, in a customer bankruptcy filing or an effort to renegotiate our contracts. The deterioration in the creditworthiness of our customers and the resulting increase in nonpayment and/or nonperformance by them could cause us to write down or write off accounts receivables or tangible and intangible assets. Such write-downs or write-offs could negatively affect our operating results in the periods in which they occur, and, if significant, could have a material adverse effect on our business, financial condition, results of operations, and cash flows.

We may not be able to keep pace with technological developments in our industry.

The oil and gas industry is characterized by rapid and significant technological advancements and introductions of new products and services using new technologies. As others use or develop new technologies, we may be placed at a competitive disadvantage, and competitive pressures may force us to implement those new technologies at substantial cost. In addition, other companies in our industry may have greater financial, technical and personnel resources that allow them to enjoy technological advantages and may allow them to implement new technologies before we can. We may not be able to respond to these competitive pressures and implement new technologies on a timely basis or at an acceptable cost. If one or more of the technologies we use now or in the future were to become obsolete or if we are unable to use the most advanced commercially available technology, our business, financial condition, results of operations and cash flows could be adversely affected.

Our initiatives related to the development of technologies for the beneficial reuse of produced water require a substantial investment by us in research and development expenses and may not be successful or achieve market acceptance.

We have incurred significant expenditures to fund our research and development efforts related to the development of technologies for the beneficial reuse of produced water, and we intend to continue those expenditures in the future. However, research and development is by its nature speculative, and there can be no assurances that these expenditures will result in the development of new technology or that any new technology we develop will be commercially marketable or profitable to us. Many of our competitors in the development of such technology are large multinational companies that have significantly greater financial and personnel resources than we have, and they may be able to devote greater resources to research and development of technologies than us. In addition, our ability to compete effectively in the beneficial reuse space may also depend on our ability to obtain patents on proprietary technology. The inability to protect any innovations through patents could adversely affect our business, financial condition and results of operations.

We may be required to take write-downs of the carrying values of our long-lived assets and finite-lived intangible assets.

We evaluate our long-lived assets, such as property and equipment, and finite-lived intangible assets for impairment whenever events or changes in circumstances indicate that their carrying value may not be recoverable. Recoverability is measured by a comparison of their carrying amount to the estimated undiscounted cash flows to be generated by those assets. Based on specific market factors and circumstances at the time of prospective impairment reviews and the continuing evaluation of development plans, economics and other factors, we may be required to write down the carrying value of our long-lived and finite-lived intangible assets. For the years ended December 31, 2024 and 2023, we recognized abandoned well costs of $0.5 million and $1.3 million, respectively, and no long-lived asset impairment expense.

We may be required to take a write-down of the carrying value of goodwill.

We conduct our annual goodwill impairment assessment during the fourth quarter of each year, or more frequently if an event or circumstance indicates that the carrying value of a reporting unit may exceed the fair value. When possible impairment is indicated, we value the implied goodwill to compare it with the carrying

37

Table of Contents

amount of goodwill. If the carrying amount of goodwill exceeds its implied fair value, an impairment charge is recorded. We may use a combination of the income approach and the market approach to determine the fair value of a reporting unit. The fair value of goodwill may be based on estimates and assumptions applied by us such as revenue growth rates, gross margins, weighted average costs of capital, market multiples, and future market conditions and is affected by numerous factors, including the general economic environment and levels of exploration and production activity of oil and gas companies, our financial performance and trends, and our strategies and business plans, among others. As a result of this annual impairment assessment, we may be required to write down the carrying value of goodwill.

Deficiencies in our internal control over financial reporting could prevent us from accurately and timely reporting our financial results.

We may identify deficiencies in our internal control over financial reporting in the future, including significant deficiencies and material weaknesses. A significant deficiency is a deficiency or a combination of deficiencies in internal control over financial reporting that is less severe than a material weakness, yet important enough to merit attention by those responsible for oversight of a company’s financial reporting. A material weakness is a deficiency, or a combination of deficiencies, in internal control over financial reporting such that there is a reasonable possibility that a material misstatement of a company’s annual or interim financial statements will not be prevented or detected on a timely basis. A deficiency in internal control exists when the design or operation of a control does not allow management or employees, in the normal course of performing their assigned functions, to prevent or detect misstatements on a timely basis.

Failure to identify deficiencies in our internal control over financial reporting in a timely manner or to remediate any deficiencies, or the identification of material weaknesses or significant deficiencies in the future could prevent us from accurately and timely reporting our financial results. Although our management is required to assess the effectiveness of our internal control over financial reporting annually, we are not required to have, or to engage our independent audit firm to perform, an audit of the effectiveness of our internal control over financial reporting for as long as we are an “emerging growth company” pursuant to the provisions of the JOBS Act. An independent assessment of the effectiveness of our internal control over financial reporting could detect problems that our management’s assessment might not. Undetected material weaknesses in our internal control over financial reporting could require us to incur the expense of remediation or lead to restatements of our financial statements, which could, in turn, cause stockholders to lose confidence in our financial reporting.

Our debt instruments have restrictive covenants that could limit our financial flexibility.

Our Credit Facility and the indenture that governs our Notes (as described under Part II, Item 7. Management’s Discussion and Analysis of Financial Condition and Results of Operations – Debt Agreements) contain financial and other restrictive covenants that limit our ability to engage in activities that may be in our long-term best interests. Our ability to borrow under our Credit Facility is subject to compliance with certain financial covenants, including leverage and interest coverage ratios. Our Credit Facility and the indenture that governs our Notes include other restrictions that, among other things, limit our ability to:

incur indebtedness;
grant liens;
engage in mergers, consolidations and liquidations;
make asset dispositions, restricted payments and investments;
enter into transactions with affiliates; and

38

Table of Contents

amend, modify or prepay certain indebtedness.

Our business plan and our compliance with these covenants are based on a number of assumptions, including our customers’ planned development and production activity remaining consistent with their communications with us, relatively predictable costs for our capital improvements, a materially consistent legal and regulatory environment, and increased demand for recycled water along with margin improvements. The significant deterioration of oil and gas production or our customers’ development activity from current levels, higher capital expenditures or reduced recycling and higher operating costs could lead to lower revenues, cash flows and earnings, which in turn could lead to a default under certain financial covenants contained in the Credit Facility. Our failure to comply with these covenants could result in an event of default that, if not cured or waived, could result in the acceleration of all of our debts. We may not have sufficient working capital to satisfy our debt obligations in the event of an acceleration of all or a significant portion of our outstanding indebtedness. Any of these events could have a material adverse effect on our business, financial condition and results of operations. See Part II, Item 7. Management’s Discussion and Analysis of Financial Condition and Results of Operations – Debt Agreements.

Our leverage may limit our ability to borrow additional funds, comply with the terms of our indebtedness, compete in our industry or capitalize on business opportunities.

Our leverage may adversely affect our ability to fund future working capital, capital expenditures and other general corporate requirements, future acquisitions, construction or development activities, or to otherwise fully realize the value of our assets and opportunities because of the need to dedicate a substantial portion of our cash flow from operations to payments on our indebtedness or to comply with any restrictive terms of our indebtedness. Our leverage may also make us less competitive. Other companies with which we compete may have greater liquidity, more unencumbered assets, less indebtedness, greater access to credit and other financial resources, lower cost structures, more effective risk management policies and procedures, greater ability to incur losses, longer-standing relationships with customers, or greater potential for profitability than we do.

Constructing and maintaining water infrastructure used in the oil and gas industry requires significant capital. We may require additional capital in the future to develop and construct water handling, sourcing, transfer and other related infrastructure to execute our growth strategy. For the years ended December 31, 2024 and 2023, our cash capital expenditures were $100.0 million and $169.7 million, respectively. Historically, we have financed these investments through cash flows from operations, external borrowings and equity capital contributions. These sources of capital may not be available to us in the future. The inability to obtain additional financing to operate our business or capitalize on business opportunities, whether because of the restrictions set forth above or otherwise, could have a material adverse effect on our business, financial condition and results of operations.

Increases in interest rates could adversely impact the price of our shares, our ability to issue equity or incur debt for acquisitions or other purposes.

Interest rates rose in recent years as a result of government actions taken in response to the data related to labor market and economic growth, government debt levels and outlook for inflation. Although the Federal Reserve lowered the target federal funds interest rate in recent months, it remains elevated relative to historical levels. In a higher interest rate environment, interest rates on borrowings, credit facilities and debt offerings could remain elevated, causing our financing costs to increase relative to existing costs. Changes in interest rates, either positive or negative, may also affect the yield requirements of investors who invest in our shares, and the higher interest rate environment could have an adverse impact on the price of our shares, or our ability to issue equity or incur debt for acquisitions or other purposes.

39

Table of Contents

A terrorist attack, armed conflict or unrest could harm our business.

The occurrence or threat of terrorist attacks in the U.S. or any of the major energy producing regions of the world or elsewhere, anti-terrorist efforts and other armed conflicts involving the U.S. or other countries, including continued hostilities in the Middle East, may adversely affect the U.S. and global economies and could have a material impact on both availability and price of oil and natural gas, which could prevent us from meeting our financial and other obligations. Additionally, destructive forms of protest and opposition by extremists and other disruptions, including acts of sabotage or eco-terrorism, against oil and natural gas development and production activities could potentially result in personal injury to persons, damages to property, natural resources or the environment, or lead to extended interruptions of our or our customers’ operations. If any of these events occur, the resulting political instability and societal disruption could reduce overall demand for oil and gas, potentially putting downward pressure on demand for our services and causing a reduction in our revenues. Oil and gas related facilities could be direct targets of terrorist attacks, and our operations could be adversely impacted if infrastructure integral to our or our customers’ operations is destroyed or damaged. Expenses related to security and costs for insurance may increase as a result of these threats, and some insurance coverage may become more difficult to obtain, if available at all.

We are subject to cybersecurity risks which could adversely affect our business.

The oil and gas industry has become increasingly dependent on digital technologies to conduct certain processing activities. We depend on digital technologies to perform many of our services and to process and record financial and operating data. Our technologies, systems and networks, and those of our vendors, suppliers and other business partners, are subject to growing risks associated with cybersecurity threats and technical disruptions, which include but are not limited to human error, power outages, computer and telecommunication failures, natural disasters, fraud or malice, social engineering attacks, viruses or malware, and other cyberattacks, such as denial-of-service or ransomware attacks. Such risks could result in the unauthorized release, gathering, monitoring, misuse, loss or destruction of proprietary and other information, or other disruption of business operations. The U.S. government has issued public warnings that energy assets might be the subject of targeted cybersecurity attacks, including by sophisticated nation state actors. Due to evolving cybersecurity threats, it has and will continue to be difficult to prevent, detect, mitigate and remediate cybersecurity incidents. While we have a cybersecurity program designed to assess, identify and manage risks from cybersecurity threats, there is no guarantee such efforts will be successful in preventing or detecting such threats. As cybersecurity threats continue to evolve, we may be required to expend additional resources to continue to modify or enhance our protective measures or to investigate and remediate any vulnerability to cybersecurity incidents. A cybersecurity incident could result in liability under applicable law, regulatory penalties, damage to our reputation or loss of confidence in us, all of which could have a material and adverse effect on our business, financial condition or results of operations. Moreover, our insurance coverage for cybersecurity incidents may not be sufficient to cover all the losses we may experience as a result of such cybersecurity incident.

Risks Related to Our Legal and Regulatory Environment

Restrictions on the ability to procure water or changes in water sourcing requirements could decrease the demand for our services.

Our business includes water transfer for use in our customers’ oil and gas E&P activities. Our access to the water we supply may be limited due to reasons such as prolonged drought or our inability to acquire or maintain water sourcing permits or other rights. In addition, some state and local governmental authorities have begun to monitor or restrict the use of water subject to their jurisdiction for hydraulic fracturing to ensure adequate local water supply. For instance, some states require E&P companies to report certain information regarding the water they use for hydraulic fracturing and to monitor the quality of groundwater surrounding some wells stimulated by hydraulic fracturing. Any such decrease in the availability of water, or demand for water services, could adversely affect our business and results of operations.

40

Table of Contents

In the future we may face increased obligations relating to the closing of our produced water handling facilities and may be required to provide an increased level of financial assurance to guarantee the appropriate closure activities occur for a produced water handling facility. 

Obtaining a permit to own or operate produced water handling facilities generally requires us to establish performance bonds, letters of credit or other forms of financial assurance to address clean-up and closure obligations. As we acquire additional produced water handling facilities or construct additional produced water handling facilities, these obligations will increase. Additionally, in the future, regulatory agencies may require us to increase the amount of our closure bonds at existing produced water handling facilities. Asset retirement obligations related to future closure obligations of our produced water handling facilities totaled $22.1 million as of December 31, 2024. Moreover, actual costs could exceed our current expectations, as a result of, among other things, federal, state or local government regulatory action, increased costs charged by service providers that assist in closing produced water handling facilities and additional environmental remediation requirements. The obligation to satisfy increased regulatory requirements associated with our produced water handling facilities could result in an increase of our operating costs and have a material adverse effect on our business, financial position and results of operations.

Our sales of groundwater and our gathering, handling and recycling of produced water expose us to potential regulatory risks.

There are unique risks associated with recycling and/or handling produced water and the legal requirements related to handling produced water, or the disposal of produced water into a non-producing geologic formation by means of underground injection wells, are subject to change based on concerns of the public or governmental authorities. There remains substantial uncertainty regarding the disposal of produced water by means of underground injection wells, which could result in substantial additional liabilities or costs to us that cannot be predicted. These include liabilities related to the handling, treatment, storage, disposal, transport, release and use of radioactive materials, which could be in produced water received from our oil and natural gas producer customers, and uncertainties regarding the ultimate, and potential exposure to, technical and financial risks associated with modifying or decommissioning produced water handling facilities. Federal or state regulatory agencies could require the shutdown of produced water handling facilities for safety reasons or refuse to permit restart of any facility after unplanned or planned outages. New or amended safety requirements and regulatory laws may give rise to additional operation and maintenance costs and capital expenditures. Additionally, aging equipment may require more capital expenditures to keep each of these produced water handling facilities operating efficiently or in compliance with applicable laws and regulations. This equipment is also likely to require periodic upgrading and improvement in order to maintain compliance. Accidents and other unforeseen problems have occurred in the past with our produced water handling, and the consequences of a major incident could be severe and include loss of life and property damage. Any resulting liability from a major environmental or catastrophic incident could exceed our resources, including insurance coverage.

Unsatisfactory safety performance may negatively affect our customer relationships and, to the extent we fail to retain existing customers or attract new customers, adversely impact our revenues.

Our ability to retain existing customers and attract new business is dependent on many factors, including our ability to demonstrate that we can reliably and safely operate our business and stay current on constantly changing rules, regulations, training and laws. If one or more accidents were to occur at one of our operating sites, the affected customer might seek to terminate or cancel its use of our facilities or services, which could cause us to lose substantial revenues. A deterioration of our safety record could also negatively impact our ability to attract and retain other customers.

41

Table of Contents

Fuel conservation measures could reduce demand for oil and natural gas which would, in turn, reduce the demand for our services.

Fuel conservation measures, alternative fuel requirements and increasing consumer demand for alternatives to oil and natural gas could reduce demand for oil and natural gas. The impact of the changing demand for oil and natural gas may have a material adverse effect on our business, financial condition, prospects, results of operations and cash flows. Additionally, the increased competitiveness of alternative energy sources (such as wind, solar, geothermal, tidal, fuel cells and biofuels) could reduce demand for hydrocarbons and therefore for our services, which would lead to a reduction in our revenues.

We are subject to environmental and occupational health and safety laws and regulations that may expose us to significant liabilities for penalties, damages or costs of remediation or compliance.

Our operations and the operations of our customers are subject to federal, state and local laws and regulations in the U.S. relating to protection of natural resources and the environment, health and safety aspects of our operations and waste management, including the disposal of waste and other materials. These laws and regulations may impose numerous obligations on our operations and the operations of our customers, including the acquisition of permits to take fresh water from surface and underground sources, construct pipelines or containment facilities, drill wells or conduct other regulated activities, the incurrence of capital expenditures to mitigate or prevent releases of materials from our facilities or from customer locations where we are providing services, the imposition of substantial liabilities for pollution resulting from our operations, and the application of specific health and safety criteria addressing worker protection. Any failure on our part or the part of our customers to comply with these laws and regulations could result in the impairment or cancellation of operations, assessment of sanctions, including administrative, civil and criminal penalties, injunctions, reputational damage, the imposition of investigatory, remedial, and corrective action obligations or the incurrence of capital expenditures; the occurrence of restrictions, delays or cancellations in the permitting, development or expansion of projects; and the issuance of injunctions restricting or prohibiting some or all of our activities in a particular area.

Our business activities present risks of incurring significant environmental regulatory compliance costs and liabilities, including costs and liabilities resulting from our handling of byproducts of the oil and natural gas production process, because of air emissions and produced water discharges related to our operations. Our business includes the operation of recycling facilities and oilfield waste disposal injection wells that pose risks of environmental liability, including leakage or accidental spills from the wells to surface or subsurface soils, surface water or groundwater. In addition, private parties, including the owners of properties upon which we perform services and facilities where our wastes are taken for recycling or disposal, also may have the right to pursue legal actions to enforce compliance as well as to seek damages for non-compliance with environmental laws and regulations or for personal injury or property or natural resource damages. Some environmental laws and regulations may impose strict and/or joint and several liability, which means that in some situations we could be exposed to liability as a result of our conduct that was lawful at the time it occurred or the conduct of, or conditions (such as environmental contamination) caused by, prior operators or other third parties. Remedial costs and other damages arising as a result of environmental laws and costs associated with changes in environmental laws and regulations could be substantial and could have a material adverse effect on our liquidity, results of operations and financial condition.

Over time, laws and regulations protecting the environment generally have the tendency to become more stringent, potentially leading to material increases in costs for future environmental compliance and remediation. The adoption of any new laws or regulations, amendment of existing laws and regulations, changes in interpretation of legal requirements or increased enforcement could restrict, delay or cancel exploratory or developmental drilling for oil and gas and could limit well servicing opportunities. We may not be able to recover some or any of our costs of compliance with these laws and regulations from insurance.

42

Table of Contents

Legislation or regulatory initiatives intended to address seismic activity could restrict our ability to recycle or handle produced water gathered from our E&P customers and, accordingly, could have a material adverse effect on our business.

Recent seismic events in the U.S. near underground disposal wells used for the disposal by injection of produced water resulting from oil and gas activities, including recent seismic events occurring in the Permian Basin near Midland, Texas, have led to concerns of the public or governmental authorities regarding disposal activities. In response to concerns regarding induced seismicity, regulators in some states have imposed, or are considering imposing, additional requirements in the permitting of produced water disposal wells to assess any relationship between seismicity and the use of such wells. Among other things, these rules require companies seeking permits for disposal wells to provide seismic activity data in permit applications, provide for more frequent monitoring and reporting for certain wells and allow the state to modify, suspend or terminate permits on grounds that a disposal well is likely to be, or determined to be, causing seismic activity. States have also issued, and may in the future issue, orders to temporarily shut down or to curtail the injection depth of existing wells in the vicinity of seismic events.

We currently operate in the states of New Mexico and Texas, where the NMOCD and TRC have recently addressed seismic activity in their respective states by curtailing injected volumes and/or suspending certain permits for disposal wells injecting into deep strata. See Items 1. and 2. Business and Properties – Regulation – Environmental and Occupational Safety and Health Matters – Water handling facilities and seismicity for recent changes in regulations.

We currently operate wells in the SRAs in Texas and New Mexico. Should the TRC or NMOCD take additional action in the existing SRAs or establish new SRAs near our operations, it could have a significant adverse effect on our business. Additionally, the adoption and implementation of any new laws, regulations or directives that restrict our ability to dispose of produced water gathered from our customers by limiting volumes, disposal rates, disposal well locations or otherwise, or requiring us to shut down disposal wells, could have a material adverse effect on our business, financial condition, and results of operations. See Part II, Item 7. Management’s Discussion and Analysis of Results of Operations – General Trends and Outlook – Seismicity for a discussion of the impact on our business.

Additional potential consequences of seismic activity are lawsuits alleging that disposal well operations have caused damage to neighboring properties or otherwise violated state and federal rules regulating waste disposal. These developments could result in additional regulation and restrictions on the use of injection wells. Increased regulation and attention given to induced seismicity could lead to greater opposition to oil and gas activities utilizing injection wells for waste disposal. The adoption and implementation of any new laws, regulations or directives that restrict our ability to recycle or handle produced water gathered from our customers by limiting volumes, disposal rates, disposal well locations or otherwise, or requiring us to shut down disposal wells, or our inability to serve our customers as required by our contracts, could result in asset impairment and could have a material adverse effect on our business, financial condition and results of operations.

Climate change legislation, laws and regulations restricting GHG emissions, promoting the development of alternative sources of energy, prohibiting, restricting, or delaying oil and gas development on public lands, or legal or other action taken by public or private entities related to climate change could force our customers to incur increased capital and operating costs and could have a material adverse effect on our financial condition, results of operations and cash flows, as well as our reputation.

As discussed above in Items 1. and 2. Business and Properties Regulation Environmental and Occupational Safety and Health Matters, international, federal, state and local governments have taken steps to reduce GHG emissions. Given the long-term trend toward increasing regulation, future federal GHG regulations of the oil and gas industry remain a possibility, and states in the US have taken measures to

43

Table of Contents

reduce GHG emissions primarily through the development of GHG emission inventories and/or regional GHG cap-and-trade programs, as well as reporting obligations.

The adoption of legislation or regulatory programs or other government action to reduce emissions of GHGs or restrict, delay or prohibit oil and gas development on public lands could further require our customers and us to incur increased operating costs, such as costs to purchase and operate emissions control systems, to acquire emissions allowances or to comply with new regulatory or reporting requirements, or prevent us from conducting operations in certain areas. Any such legislation or regulatory programs could also increase the cost of consuming, and thereby reduce demand for, the oil and gas our customers produce. Additionally, political, financial and litigation risks may result in our customers restricting, delaying or canceling production activities or impairing the ability to continue to operate in an economic manner. Consequently, legislation and regulatory programs to reduce emissions of GHGs could have an adverse effect on our business, financial condition, results of operations and cash flows.

In addition, some scientists have concluded that increasing concentrations of GHGs in the Earth’s atmosphere may produce climate changes that have significant physical effects, such as increased frequency and severity of storms, droughts, floods, wildfires and other climatic events. If such climatic events were to occur more frequently or with greater intensity, our operations and our customers’ exploration and development activities could be adversely affected, as these events could cause a loss of production from temporary cessation of activity or damaged facilities and equipment. If any such events were to occur, they could result in increased costs to repair damaged facilities or maintain or resume operations, increased insurance costs and have an adverse effect on the demand for our services and our financial condition, results of operations and cash flows. For a more complete discussion of environmental laws and regulations intended to address climate change and their impact on our business and operations, see Items 1. and 2. Business and Properties ─ Regulation ─ Environmental and Occupational Safety and Health Matters.

For a discussion of the influence of environmental laws and regulations intended to address climate change on the investment community, see Risk Factor titled “There is uncertainty related to the future of the oil and natural gas industry broadly.

A portion of our customers’ oil and gas leases are granted by the federal government. To the extent such leases are suspended or terminated, or we or our customers are unable to obtain permits or right-of-way grants required for operations on such leases, our operations could be materially affected.

A portion of our customers’ leases in New Mexico are granted by the federal government and administered by the BLM, a federal agency. Operations conducted by us and our customers on federal oil and gas leases must comply with numerous additional statutory and regulatory restrictions, including permitting obligations. In addition, the U.S. Department of the Interior (via various of its agencies, including the BLM and the Office of Natural Resources Revenue) has certain authority over our activities on federal and tribal lands. These leases contain relatively standardized terms requiring compliance with detailed regulations. Under certain circumstances, the BLM may require operations on federal leases to be suspended or terminated or may deny permits or right-of-way grants required for operations on such leases. Any such suspension or termination, or inability to obtain required permits or right-of-way grants, could materially and adversely affect our interests.

The Biden Administration, for example, took several actions to curtail oil and gas activities on federal lands, including, for example, taking a pause on new oil and natural gas leases on public lands or in offshore waters. Although the Department of the Interior has resumed processing oil and gas drilling permits, and the incoming Trump administration has begun taking steps to promote domestic oil and natural gas production, we cannot guarantee that further action will not be taken that could curtail or limit oil and gas development on federal land.

44

Table of Contents

Further, environmental incidents such as the Macondo well incident could result in similar drilling moratoria, and could result in increased federal, state, and international regulation of our and our customers’ operations that could negatively impact our earnings, prospects and the availability and cost of insurance coverage. Any additional regulation of the exploration and production industry as a whole could result in fewer companies being financially qualified to operate offshore or onshore in the U.S. or in non-U.S. jurisdictions, resulting in higher operating costs for our customers and reduced demand for our products and services.

Federal, state and local legislation and regulatory initiatives relating to hydraulic fracturing, as well as governmental reviews of such activities, could result in increased costs and additional operating restrictions, delays or cancellations in the drilling and completion of oil and gas wells that may reduce demand for our services and could have a material adverse effect on our liquidity, results of operations and financial condition.

We do not conduct hydraulic fracturing operations, but many of our customers’ oil and natural gas production operations require hydraulic fracturing as part of the well completion process. Although certain aspects of hydraulic fracturing operations are subject to current guidance or regulation, Congress has not adopted legislation to provide for federal regulation of hydraulic fracturing, and we cannot predict if such legislation will be enacted, when, or the scope of any such legislation at this time.

In addition, a number of states and local regulatory authorities and federal politicians are considering or have implemented more stringent regulatory requirements applicable to hydraulic fracturing, including bans/moratoria on drilling that effectively prohibit further production of oil and gas through the use of hydraulic fracturing or similar operations.

The adoption of new laws or regulations imposing reporting or operational obligations on, or otherwise limiting or prohibiting, the hydraulic fracturing process could make it more difficult for our customers to complete oil and gas wells in unconventional plays. In addition, if hydraulic fracturing becomes regulated at the federal level as a result of federal legislation or regulatory initiatives by the EPA, hydraulic fracturing activities could become subject to additional permitting requirements, and also to attendant permitting delays and potential increases in cost, which could adversely affect the demand for our services and results of operations.

Restrictions on drilling and related activities intended to protect certain species of wildlife or their habitat may adversely affect our customers’ ability to conduct drilling and related activities in some of the areas where we operate.

Various federal and state statutes prohibit certain actions that harm endangered or threatened species and their habitats, migratory birds, wetlands and natural resources. These statutes include the ESA, the MBTA, the BGEPA, the CWA, CERCLA and the OPA. The U.S. Fish and Wildlife Service may designate critical habitat and suitable habitat areas that it believes are necessary for survival of threatened or endangered species. A critical habitat or suitable habitat designation could result in further material restrictions to federal land use and private land use and could delay or prohibit our customers’ land access or oil and gas development. If adverse impact to species or damages to wetlands, habitat or natural resources occur or may occur as result of our or our customers’ activities, government entities or, at times, private parties may act to prevent such activities or seek damages for harm to species, habitat or natural resources resulting from our activities or our customers’ drilling, construction or releases of oil, wastes, hazardous substances or other regulated materials, which could reduce the demand for our services.

For example, the dunes sagebrush lizard, which is found in areas where we operate, was listed as endangered under the ESA in 2024, and the lesser prairie-chicken, which can also be found in areas where we operate, was listed under the ESA in 2023.

To the extent species are listed under the ESA or similar state laws, or previously unprotected species are designated as threatened or endangered in areas where our assets and operations are located, operations in

45

Table of Contents

those areas could incur increased costs arising from species protection measures and face delays or limitations with respect to production activities thereon.

Delays or restrictions in obtaining or renewing permits by us for our operations or by our customers for their operations could impair our business.

Our operations and the operations of our oil and gas producing customers typically require that we and our customers obtain and maintain a number of permits from one or more governmental agencies in order to perform drilling and completion activities, secure water rights, construct impoundments tanks, and construct and operate pipelines, produced water injection wells, handling facilities and recycling facilities. Many of these permits require a significant amount of monitoring, record keeping and reporting in order to demonstrate compliance with the underlying permit. Noncompliance or incomplete documentation of our compliance status may result in the imposition of fines, penalties and injunctive relief. Such permits are typically issued by state agencies, but federal and local governmental permits may also be required. As of December 31, 2024, we had permits for (i) approximately 195 miles of pipelines, (ii) 23 produced water handling facilities and (iii) 4 recycling facilities that, in each case, have not been constructed. We may not be able to achieve commercial operations on any particular permitted site. A decision by a governmental agency to deny or delay the renewal of any of these permits or other approval, or to revoke or substantially modify an existing permit or other approval, could adversely affect our ability to initiate or complete construction of any of these pipelines or facilities and we can provide no assurance that we will complete these projects on schedule, or at all. Additionally, these permits were issued pursuant to existing laws and regulations that are subject to change, which could result in the imposition of more stringent requirements and impair our ability to initiate or complete the construction of these pipelines and facilities.

In addition, some of our customers’ drilling and completion activities in the U.S. may take place on federal land or Native American lands, requiring leases and other approvals from the federal government or Native American tribes to conduct such drilling and completion activities. Under certain circumstances, federal agencies may cancel proposed leases for federal lands and refuse to grant or delay required approvals. Therefore, our customers’ operations in certain areas of the U.S. may be interrupted or suspended for varying lengths of time, causing a loss of revenue to us and adversely affecting our results of operations in support of those customers.

Risks Related to the Ownership of Our Class A Common Stock

We are a holding company. Our sole material asset is our equity interest in Solaris LLC and we are accordingly dependent upon distributions from Solaris LLC to pay taxes, make payments under the Tax Receivable Agreement and cover our corporate and other overhead expenses.

We are a holding company and have no material assets other than our equity interest in Solaris LLC. We have no independent means of generating revenue. To the extent Solaris LLC has available cash, we intend to cause Solaris LLC to make (i) generally pro rata advance distributions to Aris Inc. in an amount at least sufficient to allow us to pay our taxes, (ii) non-pro rata advance distributions to allow us to make payments under the Tax Receivable Agreement we have entered into with the TRA Holders and any subsequent tax receivable agreements that we may enter into in connection with future acquisitions and (iii) non-pro rata payments to us to reimburse us for our corporate and other overhead expenses. To the extent that we need funds and Solaris LLC or its subsidiaries are restricted from making such distributions or payments under applicable law or regulation or under the terms of the Credit Facility, the indenture governing the Notes or any future financing arrangements, or are otherwise unable to provide such funds, our liquidity and financial condition could be materially adversely affected.

Moreover, because we have no independent means of generating revenue, our ability to make payments under the Tax Receivable Agreement is dependent on the ability of Solaris LLC to make distributions to us in an amount sufficient to cover our obligations under the Tax Receivable Agreement. This ability, in turn, may depend on the ability of Solaris LLC’s subsidiaries to make distributions to it. The ability of Solaris LLC, its

46

Table of Contents

subsidiaries and other entities in which it directly or indirectly holds an equity interest to make such distributions will be subject to, among other things, (i) the applicable provisions of Delaware law (or other applicable jurisdiction) that may limit the amount of funds available for distribution and (ii) restrictions in relevant debt instruments issued by Solaris LLC or its subsidiaries and/other entities in which it directly or indirectly holds an equity interest. To the extent that we are unable to make payments under the Tax Receivable Agreement for any reason, such payments will be deferred and will accrue interest until paid.

For as long as we are an emerging growth company, we will not be required to comply with certain reporting requirements, including those relating to accounting standards and disclosure about our executive compensation, that apply to other public companies.

We are classified as an “emerging growth company” under the JOBS Act. For as long as we are an emerging growth company, we will not be required to, among other things: (i) provide an auditor’s attestation report on management’s assessment of the effectiveness of our system of internal control over financial reporting pursuant to Section 404(b) of the Sarbanes-Oxley Act; (ii) comply with any new requirements if adopted by the PCAOB requiring mandatory audit firm rotation or a supplement to the auditor’s report in which the auditor would be required to provide additional information about the audit and the financial statements of the issuer; (iii) provide certain disclosures regarding executive compensation required of larger public companies; or (iv) hold nonbinding advisory votes on executive compensation. We will remain an emerging growth company up until the last day of the fiscal year following the fifth anniversary of our IPO, or such earlier time that we have more than $1.235 billion of revenues in a fiscal year, have more than $700.0 million in market value of our common stock held by non-affiliates (and have been a public company for at least 12 months), or issue more than $1.0 billion of non-convertible debt over a three-year period.

To the extent that we rely on any of the exemptions available to emerging growth companies, there will be less information available about our executive compensation and internal control over financial reporting than issuers that are not emerging growth companies. If some investors find our Class A common stock to be less attractive as a result, there may be a less active trading market for our Class A common stock and our stock price may be more volatile.

In addition, once we are no longer an emerging growth company, compliance with rules and regulations that do not currently apply to us as an emerging growth company may increase our compliance costs, may make some activities more difficult or time-consuming, and may otherwise strain our systems and resources and distract management.

Our principal stockholders collectively hold a substantial portion of the voting power of our common stock.

Holders of Class A common stock and Class B common stock will vote together as a single class on all matters presented to our stockholders for their vote or approval, except as otherwise required by applicable law or our amended and restated certificate of incorporation. As of December 31, 2024, the Legacy Owners of Solaris LLC own 100% of our Class B common stock equating to a 47% economic and voting power interest in Solaris LLC of which, (i) ConocoPhillips owns approximately 47% of our Class B common stock and an approximate 22% economic interest and voting power and (ii) Yorktown Energy Partners XI, L.P. (“Yorktown”) owns approximately 37% of our Class B common stock and an approximate 18% economic interest and voting power.

Although the owners of our Class B common stock are entitled to act separately in their own respective interests with respect to their ownership in us, if they choose to act in concert, they will together have the ability to strongly influence all matters requiring stockholder approval, including mergers and other material transactions, as well as the composition of our Board or a change in control of our company that could deprive our stockholders of an opportunity to receive a premium for their Class A common stock as part of a sale of our company. The existence of significant stockholders may also have the effect of deterring hostile

47

Table of Contents

takeovers, delaying or preventing changes in control or changes in management, or limiting the ability of our other stockholders to approve transactions that they may deem to be in the best interests of our company.

In addition, we entered into a director nomination agreement with affiliates of ConocoPhillips and Yorktown in connection with the closing of the IPO. The director nomination agreement provided such holders with the right, but not the obligation, to nominate directors for election to our Board as follows: (i) ConocoPhillips has the right to nominate one nominee for election to our Board for so long as ConocoPhillips and its affiliates beneficially own at least 12.5% of the voting power of our common stock and such nominee will be a Class III director and (ii) Yorktown has the right to nominate one nominee for election to our Board for so long as Yorktown and its affiliates beneficially own at least 12.5% of the voting power of our common stock and such nominee will be a Class I director. In addition, each of ConocoPhillips and Yorktown are entitled to designate the successor for its respective Board designee whose Board service terminates prior to the end of the director’s term. The rights of each of ConocoPhillips and Yorktown will terminate on the date when such holder ceases to beneficially own at least 12.5% of the voting power of our common stock (or earlier upon written notice by such holder agreeing to terminate its rights under the agreement).

So long as the owners of our Class B common stock continue to control a significant amount of our common stock, each will continue to be able to strongly influence all matters requiring stockholder approval, regardless of whether or not other stockholders believe that a potential transaction is in their own best interests. In any of these matters, the interests of the owners of our Class B common stock may differ or conflict with the interests of our other stockholders. In addition, certain of the owners of our Class B common stock and their respective affiliates may, from time to time, acquire interests in businesses that directly or indirectly compete with our business, as well as businesses that are significant existing or potential customers. Such owners of our Class B common stock and their respective affiliates may acquire or seek to acquire assets that we seek to acquire and, as a result, those acquisition opportunities may not be available to us or may be more expensive for us to pursue. Moreover, this concentration of stock ownership may also adversely affect the trading price of our Class A common stock to the extent investors perceive a disadvantage in owning stock of a company with significant stockholders.

Certain of our directors have significant duties with, and spend significant time serving, entities that may compete with us in seeking acquisitions and business opportunities and, accordingly, may have conflicts of interest in allocating time or pursuing business opportunities.

Certain of our directors hold positions of responsibility with other entities (including affiliated entities) that are in the oil and natural gas industry. These directors may become aware of business opportunities that may be appropriate for presentation to us as well as to the other entities with which they are or may become affiliated. Due to these existing and potential future affiliations, they may present potential business opportunities to other entities prior to presenting them to us, which could cause additional conflicts of interest. They may also decide that certain opportunities are more appropriate for other entities with which they are affiliated, and as a result, they may elect not to present those opportunities to us. These conflicts may not be resolved in our favor.

Certain Designated Parties are not limited in their ability to compete with us, and the corporate opportunity provisions in our amended and restated certificate of incorporation could enable such Designated Parties and their respective affiliates to benefit from corporate opportunities that might otherwise be available to us.

Our governing documents provide that Yorktown and COG Operating LLC, a wholly-owned subsidiary of ConocoPhillips, and their respective interests in other entities and affiliates (collectively, the “Designated Parties”) are not restricted from owning assets or engaging in businesses that compete directly or indirectly with us.

48

Table of Contents

In particular, subject to the limitations of applicable law, our amended and restated certificate of incorporation, among other things:

permits such Designated Parties to conduct business that competes with us and to make investments in any kind of property in which we may make investments; and
provides that if such Designated Parties, or any employee, partner, member, manager, officer or director of such Designated Parties who is also one of our directors, becomes aware of a potential business opportunity, transaction or other matter, they will have no duty to communicate or offer that opportunity to us.

The Designated Parties may become aware, from time to time, of certain business opportunities (such as acquisition opportunities) and may direct such opportunities to other businesses in which they have invested, in which case we may not become aware of or otherwise have the ability to pursue such opportunity. Furthermore, such businesses may choose to compete with us for these opportunities, possibly causing these opportunities to not be available to us or causing them to be more expensive for us to pursue. 

Our amended and restated certificate of incorporation and amended and restated bylaws, as well as Delaware law, contain provisions that could discourage acquisition bids or merger proposals, which may adversely affect the market price of our Class A common stock and could deprive our investors of the opportunity to receive a premium for their shares.

Our amended and restated certificate of incorporation authorizes our Board to issue preferred stock without stockholder approval in one or more series, designate the number of shares constituting any series, and fix the rights, preferences, privileges and restrictions thereof, including dividend rights, voting rights, rights and terms of redemption, redemption price or prices and liquidation preferences of such series. If our Board elects to issue preferred stock, it could be more difficult for a third party to acquire us. In addition, some provisions of our amended and restated certificate of incorporation and amended and restated bylaws could make it more difficult for a third party to acquire control of us, even if the change of control would be beneficial to our stockholders. These provisions include:

dividing our Board into three classes of directors, with each class serving staggered three-year terms;
providing that all vacancies, including newly created directorships, shall, except as otherwise required by law or, if applicable, the rights of holders of a series of preferred stock, only be filled by the affirmative vote of a majority of directors then in office, even if less than a quorum (prior to such time, vacancies may also be filled by stockholders holding a majority of the outstanding shares);
permitting any action by stockholders to be taken only at an annual meeting or special meeting rather than by a written consent of the stockholders, subject to the rights of any series of preferred stock with respect to such rights;
permitting special meetings of our stockholders to be called only by our Board pursuant to a resolution adopted by the affirmative vote of a majority of the total number of authorized directors whether or not there exist any vacancies in previously authorized directorships;
requiring the affirmative vote of the holders of at least 66-2/3% in voting power of all then outstanding common stock entitled to vote generally in the election of directors, voting together as a single class, to remove any or all of the directors from office at any time, and directors will be removable only for “cause”;
prohibiting cumulative voting in the election of directors;

49

Table of Contents

establishing advance notice provisions for stockholder proposals and nominations for elections to the Board to be acted upon at meetings of stockholders;
requiring the approval of the affirmative vote of the holders of at least 66-2/3% of all then outstanding common stock entitled to vote thereon, voting together as a single class, to amend certain provisions of the amended and restated certificate of incorporation and amended and restated bylaws; and
providing that the Board is expressly authorized to adopt, or to alter or repeal our bylaws.

In addition, we are a Delaware corporation and governed by the DGCL. In general, Section 203 of the DGCL, an anti-takeover law, prohibits a publicly held Delaware corporation from engaging in a business combination, such as a merger, with a person or group owning 15% or more of the corporation’s voting stock, which person or group is considered an interested stockholder under the DGCL, for a period of three years following the date the person became an interested stockholder, unless (with certain exceptions) the business combination or the transaction in which the person became an interested stockholder is approved in a prescribed manner. We elected in our certificate of incorporation not to be subject to Section 203. However, our certificate of incorporation contains provisions that have the same effect as Section 203, except that they provide that the Designated Parties, their affiliates, and their respective successors (other than our company), as well as their direct and indirect transferees, are not deemed to be “interested stockholders,” regardless of the percentage of our voting stock owned by them, and accordingly are not subject to such restrictions. In addition, certain change of control events have the effect of accelerating the payment due under the Tax Receivable Agreement, which could be substantial and accordingly serve as a disincentive to a potential acquirer of our company. See – In certain cases, payments under the Tax Receivable Agreement may be accelerated and/or significantly exceed the actual benefits, if any, we realize in respect of the tax attributes subject to the Tax Receivable Agreement.

Our amended and restated certificate of incorporation designates the Court of Chancery of the State of Delaware as the sole and exclusive forum for certain types of actions and proceedings that may be initiated by our stockholders, and the federal district courts as the exclusive forum for Securities Act claims, which could limit our stockholders’ ability to obtain what such stockholders believe to be a favorable judicial forum for disputes with us or our directors, officers, employees or agents.

Our amended and restated certificate of incorporation provides that, unless we select or consent in writing to the selection of an alternative forum, all complaints asserting any internal corporate claims (defined as claims, including claims in the right of our Company: (i) that are based upon a violation of a duty by a current or former director, officer, employee, or stockholder in such capacity; or (ii) as to which the DGCL confers jurisdiction upon the Court of Chancery), to the fullest extent permitted by law, and subject to applicable jurisdictional requirements, shall be the Court of Chancery of the State of Delaware (or, if the Court of Chancery does not have, or declines to accept, subject matter jurisdiction, another state court or a federal court located within the State of Delaware). Further, unless we select or consent to the selection of an alternative forum, the federal district courts of the United States shall be the exclusive forum for the resolution of any complaint asserting a cause of action arising under the Securities Act. Our choice of forum provision does not apply to suits brought to enforce any liability or duty created by the Exchange Act and investors cannot waive compliance with the federal securities laws and the rules and regulations thereunder. Any person or entity purchasing or otherwise acquiring any interest in shares of our capital stock will be deemed to have notice of, and consented to, the provisions of our amended and restated certificate of incorporation described in the preceding sentence. This choice of forum provision may limit a stockholder’s ability to bring a claim in a judicial forum that it finds favorable for disputes with us or our directors, officers, employees or agents, which may discourage such lawsuits against us and such persons. Alternatively, if a court were to find these provisions of our amended and restated certificate of incorporation inapplicable to, or unenforceable in respect of, one or more of the specified types of actions or proceedings, we may incur additional costs associated with resolving such matters in other jurisdictions, which could adversely affect our business, financial condition or results of operations.

50

Table of Contents

We cannot assure that we will pay any future dividends on our Class A common stock. Our indebtedness could limit our ability to pay future dividends on our Class A common stock.

Any payment of any future dividends will be at the discretion of our Board, which comprises a majority of independent directors. We have not adopted and do not expect to adopt a written dividend policy. Although our Board declared quarterly dividends on our Class A common stock for each quarter of 2023 and 2024, our Board may determine not to declare any cash dividends in the future. Such decision will depend on, among other things, our financial condition, results of operations, projections, liquidity, earnings, legal requirements, and restrictions in our debt. In addition, our ability to pay dividends depends on our receipt of distributions from our operating subsidiaries, which may further restrict our ability to pay dividends as a result of the laws of their jurisdiction of organization, agreements of our subsidiaries or covenants under any indebtedness we or our subsidiaries incur, including the Credit Agreement (as defined in Part II, Item 7. Management’s Discussion and Analysis of Financial Condition and Results of Operations – Debt Agreements) and the indenture that governs our Notes. For more information about these restrictions, see Part II, Item 5. Market for Registrant’s Common Equity, Related Stockholder Matters and Issuer Purchases of Equity Securities – Our Dividend and Distribution Policy.

Future sales of our Class A common stock in the public market, or the perception that such sales may occur, could reduce our stock price, and any additional capital raised by us through the sale of equity or convertible securities may dilute ownership in us.

We may sell additional shares of our Class A common stock in future offerings. In addition, subject to certain limitations and exceptions, the Legacy Owners of Solaris LLC units may redeem their Solaris LLC units (together with a corresponding number of shares of Class B common stock) for shares of Class A common stock (on a one-for-one basis, subject to conversion rate adjustments for stock splits, stock dividends and reclassification and other similar transactions) and then sell those shares of Class A common stock. As of December 31, 2024 we had 30,857,526 outstanding shares of Class A common stock and 27,493,565 outstanding shares of Class B common stock. Shares of Class B common stock represented approximately 47% of our total outstanding common stock. These shares may be sold into the market in the future. Certain of the owners of our Class B shares are party to a registration rights agreement with us that requires us to effect the registration of their shares and assist with sales.

We have also filed a registration statement with the SEC on Form S-8 providing for the registration of 11,100,000 shares of our Class A common stock issued or reserved for issuance under our 2021 Equity Incentive Plan. Subject to the satisfaction of vesting conditions and the requirements of Rule 144, shares registered under the registration statement on Form S-8 may be made available for resale immediately in the public market without restriction.

We cannot predict the size of future issuances of our Class A common stock or securities convertible into Class A common stock or the effect, if any, that future issuances and sales of shares of our Class A common stock will have on the market price of our Class A common stock. Any such issuance could result in substantial dilution to our existing stockholders. Accordingly, sales of substantial amounts of our Class A common stock (including shares issued in connection with an acquisition), or the perception that such sales could occur, may adversely affect prevailing market prices of our Class A common stock. This impact could be increased to the extent there is a less active trading market for our shares.

Aris Inc. will be required to make payments under the Tax Receivable Agreement for certain tax benefits that it may claim, and the amounts of such payments could be significant.

In connection with the closing of the IPO, Aris Inc. entered into a Tax Receivable Agreement with the TRA Holders. This agreement generally provides for the payment by Aris Inc. to each TRA Holder of 85% of the net cash savings, if any, in U.S. federal, state and local income tax and franchise tax that Aris Inc. actually realizes (computed using simplifying assumptions to address the impact of state and local taxes) or is deemed to realize in certain circumstances in periods after the IPO as a result of certain increases in tax

51

Table of Contents

basis and deemed interest deductions arising from these payments. Aris Inc. will retain the remaining 15% of these cash savings.

The term of the Tax Receivable Agreement commenced on October 26, 2021 and will continue until all tax benefits that are subject to the Tax Receivable Agreement have been utilized or expired, unless we exercise our right to terminate the Tax Receivable Agreement (or the Tax Receivable Agreement is terminated due to other circumstances, including our breach of a material obligation thereunder or certain mergers, asset sales, other forms of business combination or other changes of control), and we make the termination payment specified in the Tax Receivable Agreement.

The payment obligations under the Tax Receivable Agreement are Aris Inc.’s obligations and not obligations of Solaris LLC. For the year ended December 31, 2024, we made no payments under the Tax Receivable Agreement. However, we expect that the payments we will be required to make under the Tax Receivable Agreement in the future will be substantial over the life of the agreement. We could also be required to make a lump-sum payment as discussed in the following risk factor. Estimating the amount and timing of payments that may become due under the Tax Receivable Agreement is by its nature imprecise. For purposes of the Tax Receivable Agreement, cash savings in tax generally are calculated by comparing our actual tax liability (determined by using the actual applicable U.S. federal income tax rate and an assumed combined state and local income and franchise tax rate) to the amount we would have been required to pay had we not been able to utilize any of the tax benefits subject to the Tax Receivable Agreement. The actual increase in tax basis that may result in cash tax savings to Aris Inc. under the Tax Receivable Agreement, as well as the amount and timing of any payments under the Tax Receivable Agreement, will vary depending upon a number of factors, including the timing of any acquisition or redemption of Solaris LLC units, the price of our Class A common stock at the time of each acquisition or redemption, the extent to which such acquisition or redemption is a taxable transaction, the amount and timing of the taxable income we generate in the future, the U.S. federal income tax rates then applicable, and the portion of our payments under the Tax Receivable Agreement that give rise to depreciable or amortizable tax basis.

The payments under the Tax Receivable Agreement will not be conditioned upon a holder of rights under the Tax Receivable Agreement having a continued ownership interest in us. See Items 1. and 2. – Business and Properties – Organizational Structure and Corporate Information – Tax Receivable Agreement.

In certain cases, payments under the Tax Receivable Agreement may be accelerated and/or significantly exceed the actual benefits, if any, we realize in respect of the tax attributes subject to the Tax Receivable Agreement.

If we experience a change of control (as defined under the Tax Receivable Agreement, which includes certain mergers, asset sales and other forms of business combinations and change of control events) or the Tax Receivable Agreement terminates early (at our election or as a result of our breach), we could be required to make an immediate lump-sum payment (or “early termination payment”). This payment would equal the present value of hypothetical future payments that could be required to be paid under the Tax Receivable Agreement (determined by applying a discount rate of one-year Term SOFR plus the related Benchmark Replacement Adjustment, as defined under the Tax Receivable Agreement, plus 200 basis points). The calculation of hypothetical future payments will be based upon certain assumptions and deemed events set forth in the Tax Receivable Agreement, including that (i) we have sufficient taxable income to fully utilize the tax benefits covered by the Tax Receivable Agreement (including having sufficient taxable income to utilize any accumulated net operating loss carryforwards in the manner described in the Tax Receivable Agreement) and (ii) any Solaris LLC units (other than those held by Aris Inc.) outstanding on the termination date are deemed to be redeemed on the termination date. Any early termination payment may be made significantly in advance of, and may materially exceed, the actual realization, if any, of the future tax benefits to which the termination payment relates. We currently do not anticipate experiencing a change of control or an early termination of the TRA.

52

Table of Contents

If we experience a change of control (as defined under the Tax Receivable Agreement) or the Tax Receivable Agreement otherwise terminates early, our obligations under the Tax Receivable Agreement could have a substantial negative impact on our liquidity and could have the effect of delaying, deferring or preventing certain mergers, asset sales or other forms of business combinations or changes of control.

See Items 1. and 2. – Business and Properties – Organizational Structure and Corporate Information – Tax Receivable Agreement.

We will not be reimbursed for any payments made under the Tax Receivable Agreement in the event that any tax benefits are subsequently disallowed.

Payments under the Tax Receivable Agreement will be based on the tax reporting positions that we will determine. The TRA Holders will not reimburse us for any payments previously made under the Tax Receivable Agreement if any tax benefits that have given rise to payments under the Tax Receivable Agreement are subsequently disallowed, except that excess payments made to any TRA Holder will be netted against payments that would otherwise be made to such TRA Holder, if any, after our determination of such excess. As a result, in such circumstances, we could make payments that are greater than our actual cash tax savings, if any, and may not be able to recoup those payments, which could adversely affect our liquidity.

We may be required to pay additional taxes because of the U.S. federal partnership audit rules and potentially also state and local tax rules.

Under the rules applicable to U.S. federal income tax audits of entities such as limited liability companies that are taxed as partnerships (which generally are effective for taxable years beginning after December 31, 2017), subject to certain exceptions, audit adjustments to items of income, gain, loss, deduction, or credit of an entity (and any holder’s share thereof) are determined, and taxes, interest, and penalties attributable thereto, are assessed and collected, at the entity level. It is possible that these rules could result in Solaris LLC (or any of its applicable subsidiaries or other entities in which Solaris LLC directly or indirectly invests that are treated as partnerships for U.S. federal income tax purposes) being required to pay additional taxes, interest and penalties as a result of an audit adjustment, and we, as a member of Solaris LLC (or such other entities), could be required to indirectly bear the economic burden of those taxes, interest, and penalties even though we may not otherwise have been required to pay additional corporate-level taxes as a result of the related audit adjustment. Audit adjustments for state or local tax purposes could similarly result in Solaris LLC (or any of its applicable subsidiaries or other entities in which Solaris LLC directly or indirectly invests) being required to pay or indirectly bear the economic burden of state or local taxes and associated interest, and penalties.

Under certain circumstances, Solaris LLC or an entity in which Solaris LLC directly or indirectly invests may be eligible to make an election to cause members of Solaris LLC (or such other entity) to take into account the amount of any tax understatement, including any interest and penalties, in accordance with such member’s share in Solaris LLC in the year under audit. We will decide whether or not to cause Solaris LLC to make this election; however, there are circumstances in which the election may not be available and, in the case of an entity in which Solaris LLC directly or indirectly invests, such decision may be outside of our control. If Solaris LLC or an entity in which Solaris LLC directly or indirectly invests does not make this election, the then-current members of Solaris LLC (including Aris Inc.) could economically bear the burden of the understatement.

If Solaris LLC were to become a publicly traded partnership taxable as a corporation for U.S. federal income tax purposes, Aris Inc. and Solaris LLC might be subject to potentially significant tax inefficiencies. 

We intend to operate such that Solaris LLC does not become a publicly traded partnership taxable as a corporation for U.S. federal income tax purposes. A “publicly traded partnership” is an entity like a limited

53

Table of Contents

liability company treated as a partnership for tax purposes and the interests of which are traded on an established securities market or readily tradable on a secondary market or the substantial equivalent thereof. Under certain circumstances, exchanges of Solaris LLC units pursuant to certain transfers of Solaris LLC units could cause Solaris LLC to be treated like a publicly traded partnership. From time to time the U.S. Congress has considered legislation to change the tax treatment of partnerships and there can be no assurance that any such legislation will not be enacted or if enacted will not be adverse to us. If Solaris LLC were to become a publicly traded partnership taxable as a corporation for U.S. federal income tax purposes, significant tax inefficiencies might result for Aris Inc. and Solaris LLC, including as a result of Aris Inc.’s inability to file a consolidated U.S. federal income tax return with Solaris LLC.

Aris Inc. depends on distributions from Solaris LLC to pay any dividends, if declared, taxes and other expenses.

We are a holding company and our only business is to act as the managing member of Solaris LLC. We do not have any independent means of generating revenue. We anticipate that Solaris LLC will continue to be treated as a partnership for U.S. federal income tax purposes and, as such, generally will not be subject to any entity-level U.S. federal income tax, except as otherwise described above regarding partnership audit rules. Instead, taxable income will be allocated to the members of Solaris LLC. Accordingly, Aris Inc. will be required to pay income taxes on its allocable share of any net taxable income of Solaris LLC. Subject to funds being available for distribution, we intend to cause Solaris LLC to make tax distributions to Aris Inc. in an amount intended to enable Aris Inc. to pay certain applicable taxes. In addition, Solaris LLC will reimburse Aris Inc. for corporate and other overhead expenses. If the amount of tax distributions to be made exceeds the amount of funds available for distribution, Aris Inc. shall receive the full amount of its tax distribution before the other members receive any distribution and the balance, if any, of funds available for distribution shall be distributed to the other members. To the extent that Aris Inc. needs funds, and Solaris LLC is restricted from making such distributions under applicable laws or regulations, or is otherwise unable to provide such funds, it could materially and adversely affect Aris Inc.’s ability to pay dividends and taxes and other expenses and affect our liquidity and financial condition.

In certain circumstances, Solaris LLC will be required to make distributions to us and the other members of Solaris LLC, and the distributions that Solaris LLC will be required to make may be substantial.

Solaris LLC is expected to continue to be treated as a partnership for U.S. federal income tax purposes and, as such, is not subject to U.S. federal income tax. Instead, taxable income will be allocated to members, including Aris Inc. Pursuant to the Solaris LLC operating agreement and subject to funds being available for distribution, Solaris LLC will make tax distributions to Aris Inc. to help Aris Inc. pay taxes on its allocable share of Solaris LLC’s net taxable income. If an advance is made to Aris Inc. to enable it to pay certain applicable taxes, Aris Inc. will use commercially reasonable efforts to cause Solaris LLC to make advance distributions to each of the members of Solaris LLC. The advance distributions, if any, made to the members of Solaris LLC generally will be pro rata based on each member’s ownership of Solaris LLC units, calculated based on the amount distributed to Aris Inc.

Funds used by Solaris LLC to satisfy its tax distribution obligations will not be available for reinvestment in our business. Moreover, the tax distributions Solaris LLC will be required to make may be substantial, and may significantly exceed (as a percentage of Solaris LLC’s income) the overall effective tax rate applicable to a similarly situated corporate taxpayer. In addition, because these payments will be calculated based on the anticipated tax liability of Aris Inc. at the time of each distribution, these payments may significantly exceed the actual tax liability for many of the members of Solaris LLC (including Aris Inc.).

We may receive distributions significantly in excess of our tax liabilities. We may choose to manage these excess distributions through a number of different approaches, including through the payment of dividends to our Class A common stockholders or by applying them to other corporate purposes.

54

Table of Contents

We may issue preferred stock whose terms could adversely affect the voting power or value of our Class A common stock.

Our amended and restated certificate of incorporation authorizes us to issue, without the approval of our stockholders, one or more classes or series of preferred stock having such designations, preferences, limitations and relative rights, including preferences over our Class A common stock respecting dividends and distributions, as our Board may determine. The terms of one or more classes or series of preferred stock could adversely impact the voting power or value of our Class A common stock. For example, we might grant holders of preferred stock the right to elect some number of our directors in all events or on the happening of specified events or the right to veto specified transactions. Similarly, the repurchase or redemption rights or liquidation preferences we might assign to holders of preferred stock could affect the residual value of the Class A common stock.

Unanticipated changes in effective tax rates or adverse outcomes resulting from examination of our income or other tax returns could adversely affect our results of operations and financial condition.

We are subject to taxes by the U.S. federal, state, and local tax authorities. Our future effective tax rates could be subject to volatility or adversely affected by a number of factors, including:

allocation of expenses to and among different jurisdictions;

changes in the valuation of our deferred tax assets and liabilities;

expected timing and amount of the release of any tax valuation allowances;

tax effects of stock-based compensation;

costs related to intercompany restructurings;

changes in tax laws, tax treaties, regulations or interpretations thereof; or

lower than anticipated future earnings in jurisdictions where we have lower statutory tax rates and higher than anticipated future earnings in jurisdictions where we have higher statutory tax rates.

In addition, we may be subject to audits of our income, sales and other taxes by U.S. federal, state, and local, taxing authorities. Outcomes from these audits could have an adverse effect on our operating results and financial condition.

55

Table of Contents

General Risk Factors

We may be adversely affected by uncertainty in the global financial markets and a worldwide economic downturn.

Our future results may be impacted by uncertainty caused by a worldwide economic downturn, continued volatility or deterioration in the debt and equity capital markets, changes in interest rates, continued high inflation, deflation or other adverse economic conditions that may negatively affect us or parties with whom we do business resulting in a reduction in our customers’ spending and their non-payment or inability to perform obligations owed to us, such as the failure of customers to honor their commitments. Additionally, credit market conditions may change, slowing our collection efforts as customers may experience increased difficulty in obtaining requisite financing, potentially leading to lost revenue and higher than normal accounts receivable. In the event of the financial distress or bankruptcy of a customer, we could lose all or a portion of such outstanding accounts receivable associated with that customer. Further, if a customer were to enter into bankruptcy, it could also result in the cancellation of all or a portion of our service contracts with such customer at significant expense to us.

The current global economic environment may adversely impact our ability to issue debt. Any economic uncertainty may cause institutional investors to respond to their borrowers by increasing interest rates, enacting tighter lending standards or refusing to refinance existing debt upon its maturity or on terms similar to the expiring debt. Due to the above-listed factors, we cannot be certain that additional funding will be available if needed and, to the extent required, on acceptable terms.

The widespread outbreak of an illness or any other communicable disease, or any other public health crisis, could adversely affect our business, results of operations and financial condition.

The COVID-19 pandemic caused, and any resurgence of the pandemic or other public health crisis could again cause, disruptions to our business and operational plans, which included, and may in the future include (i) shortages of qualified employees in a given area, (ii) unavailability of contractors and subcontractors, (iii) interruption of supplies from third parties upon which we rely, (iv) recommendations of, or restrictions imposed by, government and health authorities, including quarantines, (v) restrictions that we and our contractors and subcontractors impose, including facility shutdowns or access restrictions, to ensure the safety of employees, and (vi) reductions, delays or cancellations of planned operations by our customers. These disruptions could adversely affect our business, results of operations and financial condition.

Further, COVID-19 pandemic caused, and any resurgence of the pandemic or other public health crisis could again cause, economic volatility, including reduced global oil demand, disrupted global supply chains and significant volatility and disruption of financial and commodities markets.

Item 1B. Unresolved Staff Comments

None.

Item 1C. Cybersecurity

Our cybersecurity program is designed to protect our information systems and information against cybersecurity threats that may impact the confidentiality, integrity and availability of our information systems and information. Our program includes policies, processes and technologies to assess, identify and manage risks from cybersecurity threats and aligns with the National Institute of Standards and Technology (“NIST”) Cybersecurity Framework.

56

Table of Contents

Governance

The Board, in coordination with the Audit Committee, oversees the Company’s processes for assessing and managing risk. Our Board has delegated primary responsibility for overseeing our enterprise risk management process, including oversight of information technology, cybersecurity, and data privacy risks, to the Audit Committee. Despite this delegation of primary responsibility, both the Audit Committee and the Board are actively involved in risk oversight. The Board and Audit Committee regularly review the measures implemented by the Company to identify and mitigate data protection and cybersecurity risks. The Board and Audit Committee meet quarterly, or more frequently as needed, with members of the Company’s Cybersecurity Committee, which is responsible at the management level for the implementation, monitoring, and maintenance of the cybersecurity and data protection practices across the Company.

Management is responsible for identifying and assessing cybersecurity risks, establishing processes to ensure that such cybersecurity risk exposures are monitored, implementing proactive mitigation measures and responding in the event of an incident. We seek to identify and mitigate cybersecurity risks through a comprehensive, cross-functional approach. The Cybersecurity Committee headed by our Vice President of Information Technology, also includes our Chief Financial Officer and senior representatives from various corporate and operational functions. The Cybersecurity Committee meets periodically with our Chief Executive Officer and other members of our senior management to provide updates on the Company’s cyber risks and threats, cybersecurity incidents (if any), the status of projects to strengthen our information security systems, assessments of the information security program and the emerging threat landscape. The individual serving as our Vice President of Information Technology, who possesses deep experience in technology and cybersecurity gained over a career of over 20 years, leads our information technology team, which is responsible for managing our internal IT and cybersecurity processes. We have processes in place to guide our assessment, response and notification procedures upon the occurrence of a cybersecurity incident. Depending on the nature and severity of the cybersecurity incident, this process provides for notifying and escalating the incident to our Board.

Risk Management and Strategy

Our information and operational technology networks, those of our operators and managers, and those of third parties on whom we rely, are important to our ability to perform day-to-day operations of our business. Our business operations rely on the secure collection, storage, transmission and other processing of proprietary, confidential or sensitive data. As a part of our cybersecurity risk management program, we review the Company’s cybersecurity policy on an annual basis and have implemented procedures for responding to cybersecurity incidents. We provide training and awareness programs for team members that include periodic and ongoing assessments to drive adoption and awareness of cybersecurity processes and controls. We have implemented multi-factor authentication, artificial intelligence/machine learning network analysis, containment and incident response tools, vulnerability management processes and penetration testing. A third-party, 24/7 security operations center, along with an artificial intelligence network and endpoint agents, monitor alerts and actively respond in real time to threats. We also actively engage with key vendors and third-party advisors and consultants that assist us to identify, assess and manage cybersecurity risks to our business and employ processes to detect and monitor unusual network activity. In connection with our use of third-parties, we employ systems and processes designed to oversee, identify and reduce the potential impact of a security incident at such vendor or service provider.

Material Cybersecurity Risks, Threats and Incidents

The oil and gas industry has become increasingly dependent on information technology and operational technology to conduct certain processing activities. At the same time, cybersecurity incidents, including deliberate attacks or unintentional events, have increased. Due to evolving cybersecurity threats, it has and will continue to be difficult to prevent, detect, mitigate, and remediate cybersecurity incidents.

57

Table of Contents

As detailed elsewhere in this Annual Report, we rely on information technology to manage our business and support our operations, including our secure processing of proprietary and other types of information. Despite ongoing efforts, our systems for protecting against cybersecurity risks may not be sufficient, and a cyber attack or security breach could result in liability under data privacy laws, regulatory penalties, damage to our reputation or loss of confidence in us, or additional costs for remediation and modification or enhancement of our information systems to prevent future occurrences. As of the date of this report, we have not experienced any material cybersecurity incidents and are not aware of any material risks from cybersecurity threats that have materially affected or are reasonably likely to materially affect the Company, including our business strategy, results of operations or financial condition. This does not guarantee that future attacks, incidents or threats will not have a material impact or that we are not currently the subject of an undetected incident or threat that may have such an impact. For additional information on cybersecurity risks we face, see Part I, Item 1A. Risk Factors – We are subject to cybersecurity risks which could adversely affect our business, which should be read in conjunction with the foregoing information.

Item 3. Legal Proceedings

Due to the nature of our business, we may become, from time to time, involved in routine litigation or subject to disputes or claims related to our business activities. In the opinion of our management, there are no pending litigation, disputes or claims against us which, if decided adversely, will have a material adverse effect on our financial condition, cash flows or results of operations, other than the following.

Stateline Operating, LLC and Stateline Royalties, LP vs. Devon Energy Corporation, Stateline Water, LLC, Solaris Water Midstream, LLC and Aris Water Solutions, Inc., Cause No. 23-05-1085, 143rd District Court, Loving County, Texas

In May 2023, Stateline Operating, LLC and Stateline Royalties, LP (collectively “Stateline”) filed suit against Solaris Water Midstream, LLC and certain affiliates (collectively “Aris”) and Devon Energy Corporation and certain affiliates (collectively “Devon”) in Loving County, Texas, District Court. Stateline alleges that Aris and Devon’s (collectively “Defendants”) operations have harmed Stateline’s oil and gas leasehold interests through the injection of disposed saltwater. Stateline is seeking monetary damages, asserting claims for negligence, waste, trespass and nuisance. Following a ruling on dispositive motions, the trial court stayed the lawsuit while the Defendants pursue an interlocutory appeal. The trial date and all other deadlines have been vacated during this appellate process.

See Part II, Item 8. Financial Statements and Supplementary Data – Note 13. Commitments and Contingencies.

Item 4. Mine Safety Disclosures

Not applicable.

PART II

Item 5. Market for Registrant’s Common Equity, Related Stockholder Matters and Issuer Purchases of Equity Securities

Common Stock

Our Class A common stock is listed on the NYSE under the symbol “ARIS.” As of February 24, 2025, 30,971,735 shares of Class A common stock were outstanding. As of February 24, 2025, 27,493,565 shares of Class B common stock were outstanding. There is no established public trading market for the Class B common stock.

58

Table of Contents

Holders

As of February 24, 2025, the number of holders of record of our Class A common stock was 62. This number does not include the number of persons or entities whose shares are held in “street” name through brokerage firms or other nominee holders. As of February 24, 2025, the number of holders of record of our Class B common stock was 18.

Recent Sales of Unregistered Equity Securities

None.

Stock Repurchases

The following table summarizes repurchases of our common stock occurring in the fourth quarter of 2024.

Period

Total Number of Shares Purchased

Average Price Paid Per Share

Total Number of
Shares Purchased
as Part of Publicly
Announced Plans or
Programs

Approximate Dollar
Value of Shares that
May Yet Be
Purchased Under the
Plans or Programs

10/1/2024 - 10/31/2024 (1)

42,410

$

16.26

-

-

11/1/2024 - 11/30/2024 (1)

7,150

16.50

-

-

12/1/2024 - 12/31/2024 (1)

52,655

25.81

-

-

Total

102,215

$

21.20

-

-

(1)Represents shares of our Class A common stock received by us from employees for the payment of withholding taxes due as a result of the settlement of vested stock awards issued under our 2021 Equity Incentive Plan.

Our Dividend and Distribution Policy

Our Board declared a dividend of $0.09 per share for the first quarter of 2024 and a dividend of $0.105 per share for each of the second, third and fourth quarters of 2024 on our Class A common stock. Our Board declared a dividend of $0.14 per share on our Class A common stock for the first quarter of 2025.

Depending on factors deemed relevant by our Board, our Board may elect to declare future cash dividends on our Class A common stock, subject to our compliance with applicable law, and depending on, among other things, our financial condition, results of operations, projections, liquidity, earnings, legal requirements and restrictions in our debt. The payment of any future dividends will be at the discretion of our Board. We have not adopted a written dividend policy. Our Board may determine not to declare any cash dividends in the future. See Part I, Item 1A. Risk Factors We cannot assure that we will pay any future dividends on our Class A common stock. Our indebtedness could limit our ability to pay dividends on our Class A common stock. To the extent we pay any cash dividends on our Class A common stock, under the terms of our organizational documents, Solaris LLC will pay an equivalent cash distribution on the Solaris LLC units, and each share of Class A common stock and each Solaris LLC unit will receive the same cash amount.

Our ability to pay any dividends depends on our receipt of cash dividends from our operating subsidiaries, which may further restrict our ability to pay dividends as a result of the laws of their jurisdiction of organization, agreements of our subsidiaries or covenants under any existing and future outstanding indebtedness we or our subsidiaries incur. Our Credit Agreement generally permits Solaris LLC to pay distributions to us if (i) such distributions are funded using only Available Cash (as defined in the Credit Agreement) and (ii) no Default or Event of Default exists or would result therefrom.

The indenture that governs our Notes generally permits Solaris LLC to pay distributions to us if Solaris LLC’s Consolidated Leverage Ratio (as defined in such indenture) is less than or equal to 3.50 to 1.00 on a pro forma basis after giving effect to such distribution. In addition, as long as Solaris LLC’s Fixed Charge Coverage Ratio (as defined in the indenture) for the prior four fiscal quarters is not less than 2.00 to 1.00, the

59

Table of Contents

indenture permits Solaris LLC to make distributions to us so long as such distribution, together with other distributions, does not exceed a basket amount determined by adding (i) 50% of Solaris LLC’s Consolidated Net Income (as defined in the indenture) taken as one period from January 1, 2022 to the most recently completed fiscal quarter, plus (ii) cash contributions to the equity of Solaris LLC and the fair market value of property acquired with Solaris LLC’s equity interests or contributed to its common equity capital, plus (iii) certain other others items, which basket amount is reduced by distributions made pursuant to the Consolidated Leverage Ratio test described in the immediately prior sentence. Solaris LLC also has the ability under the indenture to make distributions in an amount not in excess of $15.0 million since the date of the indenture. See Part II, Item 7. Management’s Discussion and Analysis of Financial Condition and Results of Operations Debt Agreements.

As the managing member of Solaris LLC, and subject to funds being legally available, we intend to cause Solaris LLC to make (i) generally pro rata advance distributions to us in an amount at least sufficient to allow us to pay taxes, and (ii) non-pro rata advance distributions to allow us to make payments under the Tax Receivable Agreement and any subsequent tax receivable agreements that we may enter into in connection with future acquisitions, and (iii) non-pro rata payments to us to reimburse us for corporate and other overhead expenses. If an advance is made to us to enable us to pay certain applicable taxes, we will use commercially reasonable efforts to cause Solaris LLC to make advance distributions to each of the members of Solaris LLC. The advance distributions, if any, made to the members of Solaris LLC generally will be pro rata based on each member’s ownership of Solaris LLC units, calculated based on the amount distributed to us. If the amount of tax distributions to be made exceeds the amount of funds available for distribution, we will receive a portion of our tax distribution (such portion determined based on the tax rate applicable to us rather than the assumed tax rate on which tax distributions are generally based) before the other members receive any distribution and the balance, if any, of funds available for tax distributions will be distributed to the other members. Holders of our Class B common stock will not be entitled to dividends distributed by us but will share in the distributions made by Solaris LLC on a pro rata basis.

Stock Performance Graph

The graph below compares the cumulative return to holders of our Class A common stock, the Russell 2000 and the Alerian MLP Index during the period beginning on October 22, 2021, and ending on December 31, 2024. The performance graph was prepared based on the following assumptions: (i) $100 was invested in our Class A common stock and in each of the indices at the beginning of the period, and (ii) dividends were reinvested on the relevant payment dates. The stock price performance included in this graph is historical and not necessarily indicative of future stock price performance.

60

Table of Contents

Graphic

Pursuant to Instruction 7 to Item 201(e) of Regulation S-K, the above stock performance graph and related information is being furnished and shall not be deemed “filed” for purposes of Section 18 of the Exchange Act, with the SEC, and as such shall not be deemed to be incorporated by reference into any of our filings under the Exchange Act or the Securities Act.

Item 6. [Reserved]

Item 7. Management’s Discussion and Analysis of Financial Condition and Results of Operations

You should read the following discussion of our historical performance, financial condition and prospects in conjunction with our consolidated financial statements as of and for the three years ended December 31, 2024 included in Item 8. Financial Statements and Supplementary Data of this Annual Report. The information provided below supplements, but does not form part of, our historical financial statements. This discussion includes forward-looking statements that are based on the views and beliefs of our management, as well as assumptions and estimates made by our management. Actual results could differ materially from such forward-looking statements because of various risk factors, including those that may not be in the control of management. For further information on items that could impact our future operating performance or financial condition, see Part I, Item 1A. Risk Factors and the section entitled “Cautionary Statement

61

Table of Contents

Regarding Forward-Looking Statements” elsewhere in this Annual Report. We assume no obligation to update any of these forward-looking statements, except as required by law.

We have applied provisions of the SEC’s FAST Act Modernization and Simplification of Regulation S-K, which limits the discussion to the two most recent fiscal years. This discussion and analysis deals with comparisons of material changes in the consolidated financial statements for the years ended December 31, 2024 and 2023. For the comparison of the years ended December 31, 2023 and 2022, see Part II, Item 7. Management’s Discussion and Analysis of Financial Condition and Results of Operations in our Annual Report on Form 10-K for the year ended December 31, 2023 filed with the SEC on February 29, 2024.

Overview

For an overview of our business and our holding company structure, see Part I, Items 1. and 2. Business and Properties – Our Company.

Year-end Results

Significant financial and operating highlights for the year ended December 31, 2024 include:

Total water volumes handled or sold of 1,548 kbwpd, an increase of 4% from the prior year
Produced Water Handling volumes of 1,120 kbwpd, an increase of 7% from the prior year
Direct operating costs per barrel of $0.31, a decrease of 6% from the prior year
Gross margin per barrel of $0.31, an increase of 24% from the prior year
Adjusted Operating Margin per Barrel (non-GAAP financial measure) of $0.45, an increase of 15% from the prior year
Total revenue of $435.4 million, an increase of 11% from the prior year
Net income of $60.2 million, an increase of 39% from the prior year
Adjusted EBITDA (non-GAAP financial measure) of $211.9 million, an increase of 21% from the prior year
Dividend of $0.09 per share declared for the first quarter of 2024 and a dividend of $0.105 per share declared for the second, third and fourth quarters of 2024, to both our Class A common stock holders and unit holders of Solaris LLC units, an increase of 17% as compared with each of the second, third and fourth quarters of 2023
Coterra joined the Joint Industry Project with Chevron U.S.A. Inc., ConocoPhillips, ExxonMobil and the Company in July 2024

For additional information regarding our non-GAAP financial measures, see Non-GAAP Financial Measures below.

Recent Developments

Crosstek Acquisition

In February 2025, we acquired intellectual property rights and assets from Crosstek Membrane Technology LLC to help us accelerate our entry into broader industrial markets, including industrial water and wastewater treatment. We paid the seller $2.0 million in cash and included sales-based contingent consideration with a cap of $1.0 million to be paid over a four-year contractual period. See Part II, Item 8. Financial Statements and Supplementary Data – Note 4. Acquisitions.

62

Table of Contents

Surface Acreage Acquisition

In November 2024, we purchased approximately 45,000 surface acres and site improvements in New Mexico and Texas for total cash consideration of $46.1 million, inclusive of transaction costs, to secure potential disposal capacity for long-term growth. See Part II, Item 8. Financial Statements and Supplementary Data – Note 4. Acquisitions.

Beneficial Reuse Joint Industry Project

In July 2024, Coterra joined our beneficial reuse strategic agreement (the “Joint Industry Project” or “JIP”) with Chevron U.S.A. Inc., ConocoPhillips and Exxon Mobil Corporation (collectively with us, the “alliance members”) to develop and pilot technologies and processes to treat produced water for potential beneficial reuse opportunities. For more information regarding the JIP, see Part I, Items 1. and 2. Business Properties – Innovation in Recycling and Sustainable Water Management – Beneficial Reuse Joint Industry Project and Part II, Item 8. Financial Statements and Supplementary Data – Note 2. Summary of Significant Accounting Policies.

Mineral Extraction Agreement

In the second quarter of 2024, we signed a letter of intent with a development partner to construct an iodine extraction facility at one of our Permian Basin produced water management facilities. For more information, see Part I, Items 1. and 2. Business Properties – Innovation in Recycling and Sustainable Water Management – Mineral Extraction Agreement.

NAWI

In April 2024, we signed an agreement with the National Alliance for Water Innovation (“NAWI”) to further investigate treatment of produced water using one of the pilot technologies, working with alliance members and Texas A&M University, New Mexico State University, OLI Systems, Inc. and SLAC National Accelerator Laboratory. For more information, see Part I, Items 1. and 2. Business Properties – Innovation in Recycling and Sustainable Water Management – NAWI.

General Trends and Outlook

Market Dynamics

The ongoing Russia-Ukraine and Middle Eastern conflicts have had significant global economic implications and impacts on financial markets and the energy industry. The extent of these impacts will depend on the severity and duration of these conflicts and whether the conflicts spread to other countries or regions.

In addition, commodity prices have been and are continuing to be impacted by multiple factors such as supply disruptions and recessionary concerns and responses by the members of OPEC+ and other oil exporting nations to market conditions. During the year ended December 31, 2024, the average WTI crude oil spot price was $76.63 as compared with $77.58 for the year ended December 31, 2023.

We believe there are several industry trends that continue to provide meaningful support for our future growth. Our key customers’ capital allocation to the Permian Basin and New Mexico, in particular, remains consistent and significant, including on acreage where the water sourcing and production is dedicated to us. Permian Basin oil and associated water production growth continues to outpace production growth in other parts of the United States.

Many industry trends such as simultaneous multi-well operations and reuse applications of produced water, particularly in the areas of the Permian Basin where we operate, are improving efficiencies and returns and

63

Table of Contents

provide us with significant opportunities for both our Produced Water Handling and Water Solutions businesses.

Cost Inflation

Since 2021, the U.S. has experienced increased wage and price inflation, as evidenced by increases in the CPI. Although the current rate of consumer inflation has eased, core inflation remains elevated above the Federal Reserve’s 2% target rate. The rate of inflation is expected to continue to be impacted by any further steps taken by the U.S. Federal Reserve Bank, such as adjustments to interest rates.

Our long-term, fee-based produced water handling contracts are generally subject to annual CPI-based adjustments. However, many of our contractual CPI-based adjustments are capped at a maximum annual increase and, therefore, our costs may increase more rapidly than the fees that we charge to customers pursuant to our contracts with them. If inflation is higher than our contractually allowed fee increases, we could experience negative impacts to our operating margins.

Seismicity

In New Mexico, we operate four wells located within the Hat Mesa SRA that are subject to the associated Seismic Response Protocol, and we have continued to partially curtail injection in one of those wells as of December 31, 2024. There has been no further seismic activity within the Hat Mesa SRA in 2023 or 2024.

In Texas, we owned one well within the Gardendale SRA, which well was plugged and abandoned during 2023.

Due to the integrated nature of our pipeline network and our system-wide redundancy, we have been able to adapt to regulator responses to seismic activity, while continuing to provide service to our customers without material disruption in our operations. In addition, although we cannot anticipate with any certainty future regulatory actions and the effect such actions could have on our business, our compliance with state regulator seismic response actions to date has not resulted in any material volumetric, revenue or cash flow decreases.

How We Generate Revenue

We manage our business through a single operating segment comprising two primary revenue streams, Produced Water Handling and Water Solutions. Our Produced Water Handling revenue is driven by the volumes of produced water we gather from our customers, and our Water Solutions revenue is driven by the quantities of recycled produced water and groundwater delivered to our customers to support their well completion activities. See Part I, Items 1. and 2. Business Properties – Our Customers and Contracts Contracts Produced Water Handling and Contracts and Our Customers and Contracts Water Solutions for a description of our contracts.

Under our contracts with our customers, which are generally subject to periodic and limited index-based adjustments such as CPI, we receive a fixed fee per barrel of produced water received from our customers, which water is either handled or recycled, and a fixed fee per barrel of recycled water or groundwater sold to our customers. In addition, one of our significant customer contracts provides for rates that periodically fluctuate within a defined range in response to changes in WTI. See Part II, Item 7A. Quantitative and Qualitative Disclosures About Market Risk.

64

Table of Contents

Costs of Conducting Our Business

Direct Operating Costs

We incur direct operating costs primarily as a function of the number of barrels of water received, handled and treated. The major categories of direct operating costs are landowner royalties, power expenses for handling and treatment facilities, direct labor, chemicals for water treatment, water filtration expenses, workover expense and repair and maintenance of facilities. We seek to minimize, to the extent appropriate for safe and reliable operations, expenses directly tied to operating and maintaining our assets. Certain expenses, such as workover and repair and maintenance expense, may occur on an irregular basis, resulting in volatility in our operating margin.

General and Administrative Expenses

General and administrative expenses are costs incurred for overhead, including payroll and benefits for our corporate staff, stock-based compensation, costs of maintaining our offices, costs of managing our permitting operations, information technology expenses, insurance, audit and other fees for professional services and other costs incurred as a result of our being a public company.

How We Evaluate Our Results of Operations

We use a variety of financial and operational metrics to evaluate our performance. These metrics help us identify factors and trends that impact our operating results, cash flows and financial condition. The key metrics we use to evaluate our business are provided below.

Produced Water Handling Volumes

We continually seek to bring additional produced water volumes onto our system to maintain or increase throughput on our systems. These volumes are a primary revenue driver and serve as a water source for our Water Solutions business. Changes in Produced Water Handling throughput are driven primarily by the level of production and pace of completions activity on our contracted acreage. We define Produced Water Handling Volumes as all produced water barrels received from customers and any barrels that are deficient under minimum volume commitment agreements.

Water Solutions Barrels Sold

Our recycled water and groundwater sales are driven primarily by our customers’ oil and gas well completion activities. We continually seek to gain market share and expand our customer base for recycled water in the Permian Basin, as well as shifting towards providing more recycled produced water as a proportion of total water solutions volumes. We believe our access to abundant produced water volumes and the scale of our systems allows us to distribute recycled water for our customers’ completion activities in an efficient, cost effective and environmentally conscious manner. We define Water Solutions barrels sold as the total of all recycled water and groundwater barrels sold.

Revenue

We analyze our revenue and assess our performance by comparing actual revenue to our internal projections and across periods. We examine revenue per barrel of water handled or sold to evaluate pricing trends and customer mix impacts. We also assess incremental changes in revenue compared to incremental changes in direct operating costs and selling, general and administrative expenses to identify potential areas for improvement and to determine whether our performance is meeting our expectations.

We generate revenue primarily by providing fee-based services related to our Produced Water Handling and Water Solutions businesses.

65

Table of Contents

The services related to produced water are fee-based arrangements which are based on the volume of water that flows through our systems and facilities. Revenue from Produced Water Handling consists primarily of per barrel fees charged to our customers for the use of our transportation and water handling services. For our Produced Water Handling contracts, revenue is recognized over time utilizing the output method based on the volume of produced water accepted from the customer. As part of our water processing activities, we aggregate and sell recovered crude oil, also known as skim oil. Included in our Produced Water Handling revenues is skim oil sales revenue, which is recognized when custody is transferred to the purchaser and sold at market rates, net of marketing costs.

The sale of recycled produced water and groundwater are priced based on negotiated rates with our customers. For contracts that involve recycled produced water and groundwater, revenue is recognized at a point in time when control of the product is transferred to the customer.

Adjusted EBITDA

We use Adjusted EBITDA as a performance measure to assess the ability of our assets to generate sufficient cash to pay interest costs, support indebtedness and, at the discretion of our Board of Directors, return capital to equity holders. We also use Adjusted EBITDA as a performance measure under our short-term incentive plan. We define Adjusted EBITDA as net income (loss) plus: interest expense; income taxes; depreciation, amortization and accretion expense; abandoned well costs, asset impairment and abandoned project charges; losses on the sale of assets; transaction costs; research and development expense; change in payables related to the Tax Receivable Agreement liability as a result of state tax rate changes; loss on debt modification; stock-based compensation expense; and other non-recurring or unusual expenses or charges (such as litigation expenses, severance costs and amortization expense related to the implementation costs of our new enterprise resource planning system), less any gains on the sale of assets. Adjusted EBITDA is a non-GAAP financial measure. See Non-GAAP Financial Measures below for more information regarding this financial measure, including a reconciliation to its most directly comparable GAAP measure.

Adjusted Operating Margin and Adjusted Operating Margin per Barrel

Our Adjusted Operating Margin and Adjusted Operating Margin per Barrel are dependent upon the volume of produced water we gather and handle, the volume of recycled water and groundwater we sell and transfer, the fees we charge for such services, and the recurring operating expenses we incur to perform such services. We define Adjusted Operating Margin as Gross Margin (Total Revenue less Total Cost of Revenue) plus Depreciation, Amortization and Accretion. We define Adjusted Operating Margin per Barrel as Adjusted Operating Margin divided by total volumes handled, sold or transferred. Adjusted Operating Margin and Adjusted Operating Margin per Barrel are non-GAAP financial measures. See Non-GAAP Financial Measures below for more information regarding these financial measures, including a reconciliation to their most directly comparable GAAP measures for each measure.

We seek to maximize our Adjusted Operating Margin in part by minimizing, to the extent appropriate, expenses directly tied to operating our assets. Landowner royalties, power expenses for handling and treatment facilities, direct labor costs, chemical costs, water filtration expenses, workover expenses and repair and maintenance costs comprise the most significant portion of our expenses. Our operating expenses are largely variable and as such, generally fluctuate in correlation with throughput volumes.

Our Adjusted Operating Margin incrementally benefits from increased Water Solutions recycled water sales. When produced water is recycled, we recognize cost savings from reduced landowner royalties, reduced pumping costs, lower chemical treatment and filtration costs and reduced power consumption.

66

Table of Contents

Results of Operations

Results of operations were as follows for the periods indicated:

(in thousands)

Year Ended December 31, 


2024


2023


2024 vs. 2023

Revenue


Produced Water Handling

$

226,089

$

195,207

$

30,882

16

%

Produced Water Handling—Affiliate


119,263

102,322

16,941

17

%

Water Solutions


62,942

66,625

(3,683)

(6)

%

Water Solutions—Affiliate


18,057

25,611

(7,554)

(29)

%

Other Revenue

9,093

2,353

6,740

286

%

Total Revenue


435,444

392,118

43,326

11

%

Cost of Revenue


Direct Operating Costs


178,396

177,973

423

-

%

Depreciation, Amortization and Accretion


79,159

76,632

2,527

3

%

Total Cost of Revenue


257,555

254,605

2,950

1

%

Operating Costs and Expenses


Abandoned Well Costs

518

1,303

(785)

(60)

%

General and Administrative


65,315

50,454

14,861

29

%

Research and Development Expense

3,034

3,120

(86)

(3)

%

Other Operating Expense (Income), Net


2,269

(1,230)

3,499

284

%

Total Operating Expenses


71,136

53,647

17,489

33

%

Operating Income


106,753

83,866

22,887

27

%

Other Expense


Interest Expense, Net


36,233

32,853

3,380

10

%

Other

1

107

(106)

(99)

%

Income Before Income Taxes


70,519

50,906

19,613

39

%

Income Tax Expense


10,341

7,494

2,847

38

%

Net Income

$

60,178

$

43,412

$

16,766

39

%

67

Table of Contents

Operating Metrics

The amount of revenue we generate depends primarily on the volumes of water which we handle for, sell to or transfer for our customers.

Our volumes were as follows for the periods indicated:

Year Ended

December 31, 


2024


2023

2024 vs. 2023

(thousands of barrels of water per day)

Produced Water Handling Volumes

1,120

1,042

78

7

%

Water Solutions Volumes

Recycled Produced Water Volumes Sold

377

324

53

16

%

Groundwater Volumes Sold

51

126

(75)

(60)

%

Total Water Solutions Volumes

428

450

(22)

(5)

%

Total Volumes

1,548

1,492

56

4

%

Per Barrel Operating Metrics (1)

Produced Water Handling Revenue/Barrel

$

0.84

$

0.78

$

0.06

8

%

Water Solutions Revenue/Barrel

$

0.52

$

0.56

$

(0.04)

(7)

%

Revenue/Barrel of Total Volumes (2)

$

0.75

$

0.72

$

0.03

4

%

Direct Operating Costs/Barrel

$

0.31

$

0.33

$

(0.02)

(6)

%

Gross Margin/Barrel (3)

$

0.31

$

0.25

$

0.06

24

%

Adjusted Operating Margin/Barrel (4)

$

0.45

$

0.39

$

0.06

15

%

(1)Per barrel operating metrics are calculated independently. Therefore, the sum of individual amounts may not equal the total presented.
(2)Does not include Other Revenue.
(3)Gross Margin is calculated as Total Revenue less Total Cost of Revenue.
(4)See Non-GAAP Financial Measures below.

Our skim oil volumes recovered were as follows for the periods indicated:

Year Ended

December 31, 


2024


2023

2024 vs. 2023

Skim Oil Volumes (bpd)

1,688

1,219

469

38

%

Skim Oil Volumes/Produced Water Handling Volumes

0.15%

0.12%

0.03%

25

%

Skim Oil Sales Revenue/Barrel of Skim Oil (1)

$

67.75

$

69.57

$

(1.82)

(3)

%

(1)Skim oil price received from the purchaser is net of certain customary deductions, including severance taxes.

68

Table of Contents

Revenue

An analysis of revenue is as follows:

Produced Water Handling Revenue

Total Produced Water Handling revenues and Produced Water Handling revenues per barrel were as follows for the periods indicated:

(in thousands)

Year Ended December 31, 


2024


2023

2024 vs. 2023

Produced Water Handling Fees

$

303,501

$

266,573

$

36,928

14

%

Skim Oil Sales Revenue

41,851

30,956

10,895

35

%

Total Produced Water Handling Revenue

$

345,352

$

297,529

$

47,823

16

%

Produced Water Handling Fees/Barrel

$

0.74

$

0.70

$

0.04

6

%

Skim Oil Sales Revenue/Barrel of Produced Water

0.10

0.08

0.02

25

%

Total Produced Water Handling Revenue/Barrel

$

0.84

$

0.78

$

0.06

8

%

Total Produced Water Handling revenue increased for the year ended December 31, 2024 as compared with the year ended December 31, 2023 primarily due to:

an increase of $21.8 million due to a 78 kbwpd volume increase, driven primarily by activity associated with our long-term acreage dedication agreements,
an increase of $15.1 million related to higher prices for produced water volumes handled, and
an increase of $10.9 million in skim oil sales revenue due to increased volumes on the system and higher skim oil recoveries per barrel of produced water received.

Water Solutions Revenue

Water Solutions revenue had a net decrease for the year ended December 31, 2024 as compared with the year ended December 31, 2023 due to:

a decrease of $20.2 million related to a 75 kbwpd groundwater volume decrease as a result of a shift towards providing more recycled produced water as a proportion of total water solutions volumes,
a decrease of $4.3 million related to lower prices for groundwater volumes sold,
partially offset by a $9.6 million increase related to a 53 kbwpd volume increase in recycled volumes sold, and
a $3.7 million increase related to higher prices for recycled volumes sold.

Other Revenue

During the third quarter of 2024, we finalized an agreement with a third party to construct and operate a water separation facility on its behalf. We recorded $3.6 million in “Other Revenue” related to the services performed to operate the facility during the year ended December 31, 2024. See Part II, Item 8. Financial Statements and Supplementary Data – Note 2. Significant Accounting Policies. Also included in “Other Revenue” is revenue primarily related to capital recovery charges from third parties.

69

Table of Contents

Expenses

An analysis of expenses is as follows:

Direct Operating Costs

Direct operating costs for the year ended December 31, 2024 remained flat in comparison to the year ended December 31, 2023, despite a 4% increase in total volumes, as a result of our cost reduction efforts and our focus on providing more recycled produced water as a proportion of total water solutions volumes. During the year ended December 31, 2024, expenses for groundwater purchases decreased $13.6 million related to lower groundwater volumes sold and electricity and fuel costs decreased $6.1 million due to continued electrification of facilities, in comparison to the year ended December 31, 2023. These lower direct operating costs during the year ended December 31, 2024 were offset by $7.2 million in higher planned workover expenses, $4.6 million in higher landowner royalties associated with greater produced water volumes handled and $3.9 million in higher repairs and maintenance expenses, as compared with the year ended December 31, 2023.

Direct operating costs decreased $0.02 on a per barrel basis, year over year, primarily due to lower groundwater volumes sold for water solutions as we shift our focus to towards providing more recycled produced water, as well as cost efficiency from electrification and other cost reduction efforts.

Depreciation, Amortization and Accretion Expense

Depreciation, amortization and accretion expense slightly increased for the year ended December 31, 2024 as compared with the year ended December 31, 2023 primarily due to higher depreciation expense related to new assets placed in service.

Abandoned Well Costs

See Part II, Item 8. Financial Statements and Supplementary Data – Note 5. Property, Plant and Equipment.

General and Administrative Expenses

General and administrative (“G&A”) expenses increased $14.9 million for the year ended December 31, 2024 as compared with the year ended December 31, 2023 primarily due to a $6.2 million increase in stock-based compensation expense, which was $17.0 million and $10.8 million for the years ended December 31, 2024 and 2023, respectively. The remaining increase in G&A expenses during the year ended December 31, 2024 primarily related to higher compensation and benefits expenses related to higher headcount of $3.5 million, higher legal fees of $2.5 million, higher IT expenses of $1.0 million, higher office rent expense of $0.8 million primarily related to our corporate office lease which commenced in the third quarter of 2023 and $0.4 million in amortization expenses related to the implementation of our new enterprise resource planning system in the third quarter of 2024.

Research and Development Expense

Research and development expense is related to the development of technologies for the beneficial reuse of produced water, including expense related to the JIP. Total research and development expense slightly decreased for the year ended December 31, 2024 as compared to the prior year. Total research and development expense related to the JIP for the years ended December 31, 2024 and 2023 was $8.9 million and $6.4 million, respectively, which was shared equally among the alliance members. The decrease in total research and development expense for the year ended December 31, 2024, despite the year over year increase in JIP related research and development expense, is related to Coterra joining the JIP in 2024 and sharing in the expenses incurred to date.

70

Table of Contents

Other Operating Expense (Income), Net

Other operating expense (income), net includes net gains and losses on asset sales, abandoned projects, transaction costs and other expenses. See Part II, Item 8. Financial Statements and Supplementary Data – Note 3. Additional Financial Statement Information and Note 5. Property, Plant and Equipment.

Interest Expense, Net

Components of interest expense, net are as follows for the periods indicated:

Year Ended December 31, 

(in thousands)


2024


2023

Interest on Debt Instruments

$

34,481

$

34,639

Amortization of Debt Issuance Costs

3,057

2,590

Interest on Finance Lease Obligations

40

Total Interest Expense

37,578

37,229

Less: Capitalized Interest

(1,345)

(4,376)

Interest Expense, Net

$

36,233

$

32,853

Total interest expense for the year ended December 31, 2024 increased as compared with the year ended December 31, 2023 primarily due to higher amortization of debt issuance costs as a result of an amendment to our Credit Facility in October 2023 and the related costs incurred. Interest expense, net for the year ended December 31, 2024 increased as compared with the year ended December 31, 2023 due to a decrease in offsetting capitalized interest as a result of a decrease in assets under construction.

The average outstanding debt balance for the year ended December 31, 2024 was $442.5 million compared with $444.8 million for the year ended December 31, 2023. The average interest rate on outstanding debt was 7.655% for the year ended December 31, 2024 as compared with 7.654% for the year ended December 31, 2023.

Income Tax Provision

Income tax expense included in our consolidated statements of operations for the years ended December 31, 2024 and 2023 is calculated based only on our allocable share of income of Solaris LLC, which is taxed as a partnership. See Part II, Item 8. Financial Statements and Supplementary Data – Note 11. Income Taxes for a discussion of our income tax provision and effective tax rate.

Non-GAAP Financial Measures

Adjusted EBITDA, Adjusted Operating Margin and Adjusted Operating Margin Per Barrel are supplemental non-GAAP measures that we use to evaluate current, past and expected future performance. Although these non-GAAP financial measures are important factors in assessing our operating results and cash flows, they should not be considered in isolation or as a substitute for net income, gross margin or any other measures prepared under GAAP.

We use these non-GAAP measures as performance measures and believe this presentation is also used by investors and professional research analysts to assess the ability of our assets to generate sufficient cash to meet our business needs and return capital to equity holders, as well as for the comparison, rating and investment recommendations of companies within our industry. Adjusted EBITDA, Adjusted Operating Margin and Adjusted Operating Margin per Barrel are not measures of financial performance under GAAP and should not be considered as measures of liquidity or as alternatives to net income or gross margin. Adjusted EBITDA, Adjusted Operating Margin and Adjusted Operating Margin per Barrel as defined by us may not be comparable to similarly titled measures used by other companies and should be considered in conjunction

71

Table of Contents

with net income and other measures prepared in accordance with GAAP, such as gross margin, operating income or cash flows from operating activities.

Adjusted EBITDA

We use Adjusted EBITDA as a performance measure to assess the ability of our assets to generate sufficient cash to pay interest costs, support indebtedness and, at the discretion of our Board of Directors, return capital to equity holders. We also use Adjusted EBITDA as a performance measure under our short-term incentive plan, as well as for comparative purposes within our industry. We define Adjusted EBITDA as net income (loss) plus: interest expense; income taxes; depreciation, amortization and accretion expense; abandoned well costs, asset impairment and abandoned project charges; losses on the sale of assets; transaction costs; research and development expense; change in payables related to the Tax Receivable Agreement liability as a result of state tax rate changes; loss on debt modification; stock-based compensation expense; and other non-recurring or unusual expenses or charges (such as litigation expenses, severance costs and amortization expense related to the implementation costs of our new enterprise resource planning system), less any gains on the sale of assets. Adjusted EBITDA is a non-GAAP financial measure.

Adjusted Operating Margin and Adjusted Operating Margin per Barrel

Our Adjusted Operating Margin and Adjusted Operating Margin per Barrel are dependent upon the volume of produced water we gather and handle, the volume of recycled water and groundwater we sell and transfer, the fees we charge for such services and the recurring operating expenses we incur to perform such services. We define Adjusted Operating Margin as Gross Margin plus depreciation, amortization and accretion. We define Adjusted Operating Margin per Barrel as Adjusted Operating Margin divided by total volumes handled, sold or transferred. Adjusted Operating Margin and Adjusted Operating Margin per Barrel are non-GAAP financial measures.

We seek to maximize our Adjusted Operating Margin in part by minimizing, to the extent appropriate, expenses directly tied to operating our assets. Landowner royalties, power expenses for handling and treatment facilities, direct labor costs, chemical costs, water filtration expenses, workover expenses and repair and maintenance costs comprise the most significant portion of our expenses. Our operating expenses are largely variable and as such, generally fluctuate in correlation with throughput volumes.

Our Adjusted Operating Margin incrementally benefits from increased Water Solutions recycled water sales. When produced water is recycled, we recognize cost savings from reduced landowner royalties, reduced pumping costs, lower chemical treatment and filtration costs and reduced power consumption.

72

Table of Contents

The following table sets forth a reconciliation of net income as determined in accordance with GAAP to Adjusted EBITDA and a reconciliation of gross margin as determined in accordance with GAAP to Adjusted Operating Margin for the periods indicated:

(in thousands)

Year Ended December 31, 


2024


2023

Net Income

$

60,178

$

43,412

Interest Expense, Net

36,233

32,853

Income Tax Expense

10,341

7,494

Depreciation, Amortization and Accretion

79,159

76,632

Abandoned Well Costs

518

1,303

Stock-Based Compensation

18,189

11,569

Abandoned Projects

1,537

216

Loss (Gain) on Disposal of Asset, Net

102

(2,606)

Transaction Costs

997

802

Research and Development Expense

3,034

3,120

Change in Payables Related to Tax Receivable Agreement Liability

229

413

Litigation Expenses

1,580

222

Other

(212)

(458)

Adjusted EBITDA

$

211,885

$

174,972

Total Revenue

$

435,444

$

392,118

Cost of Revenue

(257,555)

(254,605)

Gross Margin

177,889

137,513

Depreciation, Amortization and Accretion

79,159

76,632

Adjusted Operating Margin

$

257,048

$

214,145

Total Volumes (thousands of barrels)

566,547

544,647

Adjusted Operating Margin/Barrel

$

0.45

$

0.39

Liquidity and Capital Resources

Overview

We have a disciplined capital allocation process and evaluate all growth capital expenditures on a project-level returns basis. We maintain close relationships and open communication with our customers, which allows us to accelerate or delay our capital plans in real-time as we seek to maximize our efficiency and return on capital deployed.

Our management has successfully permitted, developed, constructed and operated the assets needed to service growing total barrels handled, sold or transferred in the Permian Basin, while maintaining a conservative capital structure and what we believe to be sufficient liquidity and ample financial flexibility to meet our objectives and those of our customers. We intend to continue to pursue accretive growth projects that meet our return thresholds and strategically improve the value of our assets. Our integrated network provides accretive, organic growth opportunities where we expect to expand and enhance the value of our existing infrastructure.

In addition, we plan to evaluate and strategically pursue acquisitions that create synergies, strengthen our relationships with existing and prospective customers and meet our financial return thresholds while maintaining significant balance sheet flexibility.

Our primary needs for cash are permitting, development and construction of water handling and recycling assets to meet customers’ needs and payment of contractual obligations, including debt and working capital obligations. When appropriate, we may enhance shareholder returns by returning capital to shareholders,

73

Table of Contents

such as through dividends and share buybacks (to the extent determined by our Board), subject to any legal requirements, restrictions in our debt and other factors described under Our Dividend and Distribution Policy in Part II, Item 5. Funding for these cash needs may be provided by any combination of internally generated cash flow, borrowings under the Credit Facility or accessing the capital markets. We believe that our cash flows, availability under our Credit Facility and leverage profile provide us with the financial flexibility to fund attractive growth opportunities in the future.

On December 31, 2024, the performance period ended for 107,225 PSUs previously issued. Each PSU was converted into 1.57 shares representing 168,742 shares of Class A common stock that were issued in February 2025.

As of December 31, 2024, we had a cash balance of $28.7 million and working capital, defined as current assets less current liabilities, of $22.8 million. We had $400.0 million face value of Notes outstanding and $44.0 million outstanding under our Credit Facility, with $302.7 million of availability under our Credit Facility. As of December 31, 2024, we were in compliance with all the covenants under our Credit Facility and the indenture governing the Notes. 

As of February 24, 2025, we had $62.0 million of outstanding borrowings under our Credit Facility at a weighted average interest rate of 7.15 %. The borrowings are primarily being used to fund our capital program.

Dividends and Distributions

Dividends reflect our confidence that we can return cash to our shareholders while also continuing to invest in high-return growth projects and manage our balance sheet. Our infrastructure, scale, and customer base will allow us to balance attractive reinvestment opportunities with a conservative balance sheet and consistent return of capital to shareholders. Dividends are also paid on unvested shares of restricted stock and restricted stock units, as well as vested but not issued restricted stock units. Dividends accrue on performance-based restricted stock units and are paid upon vesting.

Our Board of Directors declared a dividend of $0.09 per share for the first quarter of 2024 and a dividend of $0.105 per share for each of the second, third and fourth quarters of 2024 on our Class A common stock. In conjunction with the dividend payments, a distribution of $0.09 per unit was paid to unit holders of Solaris LLC for the first quarter, and a distribution of $0.105 per unit was paid to unit holders of Solaris LLC for each of the second, third and fourth quarters of 2024. The 2024 quarterly dividends and distributions declared totaled $24.9 million, of which $24.6 million was paid during the year ended December 31, 2024. The difference between declarations and cash payments during 2024 was related to the dividends accrued for unvested performance-based restricted stock units

On February 26, 2025, our Board declared a dividend on our Class A common stock for the first quarter of 2025 of $0.14 per share. In conjunction with the dividend payment, a distribution of $0.14 per unit will be paid to unit holders of Solaris LLC. The dividend will be paid on March 27, 2025 to holders of record of our Class A common stock as of the close of business on March 13, 2025. The distribution to unit holders of Solaris LLC will be subject to the same payment and record dates.

Cash Flows from Operating Activities

Net cash provided by operating activities totaled $178.9 million for the year ended December 31, 2024 as compared with $183.9 million for the year ended December 31, 2023. Net cash provided by operating activities had a net decrease year over year, primarily as a result of changes in working capital items, other than cash, which included a net increase of $6.7 million and $43.8 million for the years ended December 31, 2024 and 2023, respectively, related to improved collections timing on accounts receivables balances. Additionally, in relation to working capital changes during the years ended December 31, 2024 and 2023, there was a $10.4 million change in accounts payable activity year over year, primarily as a result of lower

74

Table of Contents

property, plant and equipment expenditures incurred in 2024, partially offset by higher changes in other receivables activity during the year ended December 31, 2023 as a result of higher insurance and JIP related receivables incurred during the year ended December 31, 2023.

Cash Flows from Investing Activities

Net cash used in investing activities totaled $145.6 million for the year ended December 31, 2024 as compared with $149.6 million for the year ended December 31, 2023. Expenditures for property plant and equipment were $100.0 million for the year ended December 31, 2024, as compared with $169.7 million for the year ended December 31, 2023. The decrease in expenditures during the year ended December 31, 2024 was a result of lower capital spending required to accommodate our long-term contracted customers. The year ended December 31, 2024 includes $46.1 million cash paid for the acquisition of surface acreage, and the year ended December 31, 2023 includes $20.1 million in cash proceeds related to an asset sale. See Part II, Item 8. Financial Statements and Supplementary Data – Note 4. Acquisitions and Note 5. Property, Plant and Equipment for more information.

Cash Flows from Financing Activities

Net cash used in financing activities totaled $9.7 million for the year ended December 31, 2024 and included $18.0 million in net Credit Facility proceeds. Also included is $24.6 million in cash dividends and distributions paid and $3.6 million treasury stock repurchases related to tax withholding on stock awards that vested. Net cash used in financing activities for the year ended December 31, 2024 also included an $8.8 million insurance premium financing agreement entered into in November 2024, partially offset by $7.8 million in payments related to the current and prior insurance financing agreements.

Net cash used in financing activities totaled $30.4 million for the year ended December 31, 2023 and included $9.0 million in net Credit Facility repayments. Also included is $3.9 million in debt issuance costs related to the amended and restated Credit Agreement, as well as $21.4 million cash dividends and distributions paid and $1.4 million treasury stock repurchases related to tax withholding on stock awards that vested. Net cash used in financing activities for the year ended December 31, 2023 also included a $6.6 million insurance premium financing agreement entered into in December 2023, partially offset by $1.3 million in payments on the agreement. See below and Part II, Item 8. Financial Statements and Supplementary Data – Note 9. Debt for additional information.

Capital Requirements

Our business is capital intensive, requiring the maintenance of existing pipelines, pumps and handling and recycling facilities, salt water disposal (“SWD”) well recompletions or workovers, and the acquisition or construction and development of new assets and facilities.

We maintain significant flexibility around the timing of capital expenditures. However, we are subject to certain capital requirements to support our customers’ development plans associated with acreage dedication agreements.

Accordingly, we work proactively with our customers to anticipate their future needs for water handling and recycling assets to support their activities. For 2025, we expect our capital expenditures will be between approximately $85.0 million to $105.0 million, which is based on our currently contracted customers’ latest outlooks on our dedicated acreage. Factors that could result in an increase in our capital expenditures include an increase in expected drilling activity due to the sale or exchange of dedicated acreage to customers with more active drilling practices and other changes in drilling programs. We intend to fund capital requirements through our primary sources of liquidity, which include cash on hand and cash flows from operations and, if needed, our borrowing capacity under the Credit Facility.

75

Table of Contents

Debt Agreements

Credit Facility

Our amended and restated credit agreement (as it may be amended and/or restated from time to time, the “Credit Agreement”) provides for, among other things, (i) commitments of $350.0 million, (ii) a maturity date of October 12, 2027, with a springing maturity of 91 days ahead of the Notes’ due date of April 1, 2026 in the event the Notes are voluntarily redeemed, repurchased, refinanced or otherwise retired in full prior to such springing maturity date, (iii) loans made under our revolving credit facility (the “Credit Facility”) and unused commitment fees to be determined based on a leverage ratio ranging from 3.00:1.00 to 4.50:1.00, (iv) an accordion feature permitting the Company to seek an increase of the Credit Facility of up to $150.0 million, subject to certain conditions, (v) a leverage ratio covenant which comprises a maximum total funded debt to EBITDA ratio, net of $40.0 million of unrestricted cash and cash equivalents if the facility is drawn, and net of all unrestricted cash and cash equivalents if the facility is undrawn, (vi) a leverage ratio covenant test level which is currently 4.50 to 1.00 and (vii) a secured leverage ratio covenant of 2.50 to 1.00.

The Credit Facility provides for, at our option:

i.Base rate borrowings that bear interest at the highest of (a) the prime rate, (b) the federal funds effective rate plus 0.50% and (c) Term SOFR for an interest period of one month plus 1.00%; plus a margin ranging from 175 basis points to 275 basis points, depending upon our leverage ratio; or
ii.SOFR borrowings that bear interest at Term SOFR plus SOFR Adjustment of 0.10% plus a margin ranging from 275 basis points to 375 basis points, depending upon our leverage ratio.

In addition, the Credit Facility provides for commitment fee rates that range from 37.5 basis points to 50.0 basis points, depending upon our leverage ratio.

The Credit Facility is secured by all of the real and material personal property owned by Solaris LLC or any of its subsidiaries, other than certain excluded assets. As of December 31, 2024, we were in compliance with all covenants under the Credit Facility.

Senior Sustainability-Linked Notes

We have $400.0 million aggregate principal amount of 7.625% Senior Sustainability-Linked Notes (“Notes”) outstanding, which are due April 1, 2026. The Notes were issued by Solaris LLC on April 1, 2021 and are unsecured and effectively subordinated to the Credit Facility to the extent of the value of the collateral securing the Credit Facility. The Notes are guaranteed on a senior unsecured basis by all of Solaris LLC’s wholly owned subsidiaries. Interest on the Notes is payable on April 1 and October 1 of each year. We may redeem all or part of the Notes at any time at a redemption price of 101.9063% through March 31, 2025 and a redemption price of 100% on or after April 1, 2025. If we undergo a change of control, we may be required to repurchase all or a portion of the Notes at a price equal to 101% of the principal amount of the Notes, plus accrued interest.

We used the proceeds from the issuance of the Notes to repay all borrowings outstanding under our Credit Facility, to redeem all outstanding redeemable preferred units in full and for general corporate purposes.

The indenture that governs the Notes contains covenants that, among other things, limit our ability and the ability of our restricted subsidiaries to:

incur or guarantee additional indebtedness or issue certain preferred stock;
pay dividends on capital stock or redeem, repurchase or retire our capital stock or subordinated indebtedness;

76

Table of Contents

transfer or sell assets;
make investments;
create certain liens;
enter into agreements that restrict dividends or other payments from our restricted subsidiaries to us;
consolidate, merge or transfer all or substantially all of our assets;
engage in transactions with affiliates; and
create unrestricted subsidiaries.

Our KPI under our Sustainability-Linked Bond Framework was to increase recycled produced water sold and reduce groundwater withdrawals sold expressed as a percentage of barrels of recycled produced water sold per year divided by total barrels of water sold per year (the “Recycling KPI”). Our Recycling KPI was designed to reduce groundwater withdrawal for water intensive industrial operations in the water stressed Permian Basin by increasing our sales of recycled produced water. Our Sustainability Performance Target (as defined in the indenture governing the Notes) was to increase our annual Recycling KPI to 60% by 2022 from a 2020 baseline of 42.1%, with an observation date of December 31, 2022.

As of December 31, 2022, our annual Recycling KPI was approximately 74%. During 2023, we notified the trustee for the Notes that, for the year ended December 31, 2022, we had satisfied the Sustainability Performance Target in accordance with the requirements and procedures of the indenture. As a result, the interest rate on the Notes will remain 7.625% for the remainder of the term of the Notes.

We were in compliance with all covenants under the indenture governing the Notes as of December 31, 2024.

Insurance Premium Financing

In the fourth quarter of 2024, we entered into a short-term agreement with a third-party to finance certain insurance premiums for an aggregate amount of $8.8 million. Under the terms and provisions of the agreement, the insurance premium financing is repayable in 11 monthly installments of principal and interest through September 2025, at a weighted-average annual percentage rate of 6.99%. As of December 31, 2024, the remaining balance was $6.7 million and is included in “Insurance Premium Financing Liability” on the consolidated balance sheet.

In the fourth quarter of 2023, we entered into a short-term agreement with a third-party to finance certain insurance premiums for an aggregate amount of $6.6 million, at a weighted-average annual percentage rate of 7.49% and similar terms to the insurance premium financing described above. This insurance premium financing was fully repaid as of September 30, 2024.

Tax Receivable Agreement

At the closing of the IPO, we entered into the TRA with the TRA Holders. The TRA generally provides for the payment by us to each TRA Holder of 85% of the net cash savings, if any, in U.S. federal, state and local income tax and franchise tax that we actually realize (computed using simplifying assumptions to address the impact of state and local taxes) or are deemed to realize in certain circumstances in periods after the IPO as a result of certain increases in tax basis that occur as a result of our acquisition or Solaris LLC’s redemption, respectively, of all or a portion of such TRA Holder’s Solaris LLC units in connection with the IPO or pursuant to the exercise of a redemption right or call right. We retain the remaining 15% of these cash savings. The future benefit of these cash savings is included, alongside other tax attributes, in our total deferred tax asset

77

Table of Contents

balances at December 31, 2024 and 2023. As of December 31, 2024 and 2023, the estimated TRA liability totaled $98.9 million and $98.3 million, respectively. The increase to the TRA liability is due to the redemption of Class B common shares to Class A common shares, which increased the liability by $0.4 million, and a state tax rate change, which increased the liability by $0.2 million.

We expect to fund any payments related to annual tax savings with cash on hand or cash from operations that would otherwise have been used by us to pay taxes. In addition, such payments will only be made to the extent we are able to realize actual tax savings, and generally we may elect to defer payments due under the TRA if we do not have available cash to satisfy our payment obligations under the TRA or if our contractual obligations limit our ability to make these payments. Any such deferred payments under the TRA generally will accrue interest.

If we experience a change of control (as defined under the TRA, which includes certain mergers, asset sales and other forms of business combinations and change of control events) or the TRA terminates early (at our election or as a result of our breach), we could be required to make a substantial, immediate lump-sum payment (or “early termination payment”) under the terms of the TRA, which can be significantly impacted by the closing price of our Class A shares on the applicable termination date or change of control date.

Other Commitments

In the normal course of business, we enter into certain short-term purchase obligations and commitments for products and services, primarily related to purchases of pipe, pumps and other components. As of December 31, 2024, we had purchase obligations and commitments of approximately $5.1 million due in the next twelve months.

In 2023, we entered into an agreement with an unaffiliated water disposal company to dispose a minimum volume of produced water over a term of seven years, for a total financial commitment of approximately $28.0 million, undiscounted, and not including annual CPI adjustments. We began delivering produced water under this agreement in June 2023. As of December 31, 2024, the remaining minimum commitment was $22.4 million, undiscounted. See Part II, Item 8. Financial Statements and Supplementary Data – Note 13. Commitments and Contingencies for more information.

We are a party to various surface use and compensation agreements by which we have committed to make minimum royalty payments in exchange for rights to access and use the land for purposes that are generally limited to conducting water operations. These agreements do not meet the definition of a lease under ASC Topic 842. As of December 31, 2024, the minimum royalty payments associated with these contracts are as follows: $3.7 million for 2025, $11.3 million for 2026, $1.4 million for 2027, $1.4 million for 2028 and $1.7 million for 2029.

We are party to a fixed price power purchase contract to manage the volatility of the price of power needed for ongoing operations. We have elected the normal purchase and normal sale accounting treatment for this contract and therefore record it at cost. In May 2024, we extended the fixed price power purchase contact through April 2028. As of December 31, 2024, the minimum commitment under the contract is $5.8 million for 2025, $7.9 million for 2026, $7.9 million for 2027 and $3.1 million for 2028.

See Part II, Item 8. Financial Statements and Supplementary Data – Note 13. Commitments and Contingencies for additional information.

See also Tax Receivable Agreement, above.

We have not entered into any other transactions, agreements or other contractual arrangements that would result in off-balance sheet liabilities.

78

Table of Contents

Critical Accounting Estimates

The preparation of financial statements and related disclosures in conformity with GAAP requires the selection and application of appropriate accounting principles to the relevant facts and circumstances of our operations and the use of assumptions and estimates made by management. We base our assumptions, estimates and judgments on historical experience, current trends and other factors believed to be relevant at the time our consolidated financial statements are prepared.

Our significant accounting policies are discussed in Item 1. Financial Statements – Note 2. Summary of Significant Accounting Policies. We believe the following accounting estimates are the most critical to aid in fully understanding and evaluating our reported financial position and results of operations. The application of these accounting estimates, which requires our most subjective or complex judgments regarding estimates and projected outcomes of future events, and changes in these accounting estimates, could have a material effect on our financial statements.

Acquisitions

To determine if a transaction should be accounted for as a business combination or an acquisition of assets, we first calculate the relative fair values of the assets acquired. If substantially all of the relative fair value is concentrated in a single asset or group of similar assets, or, if not, but the transaction does not include a significant process (does not meet the definition of a business), we record the transaction as an acquisition of assets. For acquisitions of assets, the purchase price is allocated based on the relative fair values. For an acquisition of assets, goodwill is not recorded. All other transactions are recorded as business combinations.

Fair values of assets acquired and liabilities assumed are based upon available information and may involve engaging an independent third party to perform an appraisal. Estimating fair values can be complex and subject to significant business judgment. We must also identify and include in the allocation all acquired tangible and intangible assets that meet certain criteria, including assets that were not previously recorded by the acquired entity. The estimates most commonly involve the fair value of property, plant and equipment and intangible assets, including those with indefinite lives, the fair value of contracts and contingent consideration liabilities. For a business combination, the excess of the purchase price over the net fair value of acquired assets and assumed liabilities is recorded as goodwill, which is not amortized but instead is evaluated for impairment at least annually. Pursuant to GAAP, an entity is allowed a reasonable period of time (not to exceed one year) to obtain the information necessary to identify and measure the fair value of the assets acquired and liabilities assumed in a business combination.

The assumptions made in performing these valuations require significant judgment on the part of management and may include, but are not limited to, discount rate, future revenue and operating costs, projections of capital costs, and other assumptions believed to be consistent with those used by principal market participants.

Impairment of Long-Lived Assets

We evaluate the carrying value of our long-lived assets (property, plant and equipment and amortizable intangible assets) for potential impairment when events and circumstances warrant such a review. A long-lived asset group is considered impaired when the anticipated undiscounted future cash flows from the use and eventual disposition of the asset group is less than its carrying value. We compare the carrying value of the long-lived asset to the estimated undiscounted future cash flows expected to be generated from that asset. Estimates of future net cash flows include estimating future volumes and margins, future operating costs and other estimates and assumptions consistent with our business plans. If we determine that an asset’s unamortized cost may not be recoverable due to impairment, we may be required to reduce the carrying value and the subsequent useful life of the asset. Any such write-down of the value and unfavorable change in the useful life of a long-lived asset would increase costs and expenses at that time. Fair value calculations for long-lived assets and intangible assets contain uncertainties because it requires us to apply

79

Table of Contents

judgment and estimates concerning future cash flows associated with operating the asset, strategic plans, useful lives and market performance. We also apply judgment in the selection of a discount rate that reflects the risk inherent in the current business model.

For the years ended December 31, 2024 and 2023, we recognized abandoned well costs of $0.5 million and $1.3 million, respectively, and did not record any long-lived asset impairment expense.

Impairment of Goodwill

Goodwill is subject to at least an annual assessment for impairment. We perform our annual impairment assessment during the fourth quarter of our fiscal year, and more frequently if circumstances warrant. For our reporting unit, we perform a qualitative assessment of relevant events and circumstances about the likelihood of goodwill impairment. If it is deemed more likely than not that the fair value of the reporting unit is less than its carrying value, we calculate the fair value of the reporting unit. Otherwise, further testing is not required. We base our qualitative assessment on factors relevant to the business, such as macroeconomic, industry, market, cost factors, overall financial performance, other entity specific events, or any other factors that have a significant bearing on fair value.

We performed our annual goodwill impairment test using qualitative factors during the fourth quarter of 2024 and concluded there were no new impairment triggering events as of and for the year ended December 31, 2024. As such, there was no goodwill impairment as of December 31, 2024.

If it is necessary to determine the fair value of a reporting unit, we may use a combination of the income approach and the market approach. Under the income approach, the determination of a reporting unit’s fair value is predicated on our assumptions regarding the future economic prospects of the reporting unit. Such assumptions include (i) discrete financial forecasts for the assets contained within the reporting unit, which rely on our estimates of gross margins, (ii) long-term growth rates for cash flows beyond the discrete forecast period, (iii) appropriate discount rates and (iv) estimates of the cash flow multiples to apply in estimating the market value of our reporting units.

Under the market approach, we estimate the value of the reporting unit by comparison to similar businesses whose securities are actively traded in the public market. This requires management to make certain judgments about the selection of comparable companies and/or comparable recent company and asset transactions and transaction premiums. We use a peer company multiple method for the market approach. Market multiples represent market estimates of fair value based on selected financial metrics. We use earnings before interest, taxes, depreciation, amortization and accretion expense (also known as EBITDA) as our financial metric as we believe it more accurately compares companies in our industry.

Determining the fair value of a reporting unit is judgmental in nature and involves the use of significant estimates and assumptions. For example, reporting unit fair value may be calculated using a discounted cash flow model, which would require the use of significant unobservable inputs including assumptions such as discount rate, revenue growth rates, future operating margins, future capital expenditures, changes in working capital requirements and terminal growth rates. Such estimates would represent a Level 3 fair value measurement.

If the fair value of the reporting unit (including its inherent goodwill) is less than its carrying value, we recognize an impairment charge for the amount by which the carrying amount exceeds the implied fair value; however, the loss recognized may not exceed the total amount of goodwill allocated to that reporting unit.

If future results are not consistent with our estimates, we could be exposed to future impairment losses that could be material to our results of operations. We monitor the markets for our products and services, in addition to the overall market, to determine if a triggering event occurs that would indicate that the fair value of a reporting unit is less than its carrying value.

80

Table of Contents

Income Taxes

Our provision for income taxes includes both federal and state taxes of the jurisdictions in which we operate. We estimate our overall tax rate using a combination of the enacted federal statutory tax rate, and a blend of enacted state tax rates. Acquisitions or dispositions of assets and changes in our operations by tax jurisdiction could change the apportionment of our state taxes, which would impact our overall tax rate.

We account for income taxes in accordance with ASC 740, “Accounting for Income Taxes” (“ASC 740”), which requires the recognition of tax benefits or expenses on temporary differences between the financial reporting and tax bases of our assets and liabilities by applying the enacted tax rates in effect for the year in which the differences are expected to reverse. Such net tax effects on temporary differences are reflected in our consolidated balance sheet as deferred tax assets. Deferred tax assets are reduced by a valuation allowance when we believe that it is more likely than not that some portion or all of the deferred tax assets will not be realized.

ASC 740 prescribes a two-step approach for the recognition and measurement of tax benefits associated with the positions taken or expected to be taken in a tax return that affect amounts reported in the consolidated financial statements. We have reviewed and will continue to review the conclusions reached regarding uncertain tax positions, which may be subject to review and adjustment at a later date based on ongoing analyses of tax laws, regulations and interpretations thereof. For the years ended December 31, 2024 and 2023, no unrecognized tax benefit was recorded. To the extent that our assessment of the conclusions reached regarding uncertain tax positions changes as a result of the evaluation of new information, such change in estimate will be recorded in the period in which such determination is made. We report income tax-related interest and penalties relating to uncertain tax positions, if applicable, as a component of other expense. For the years ended December 31, 2024 and 2023, no such amounts were recorded.

Our federal and state income tax returns are not prepared or filed before the consolidated financial statements are prepared; therefore, we estimate the tax basis of our assets and liabilities and tax attributes, which are based on numerous judgments and assumptions inherent in the determination of taxable income, at the end of each period. In addition, the calculation of our income tax expense (benefit) involves dealing with uncertainties in the application of complex tax laws and regulations in the jurisdictions in which we operate. Adjustments related to these estimates are recorded in our tax provision in the period in which we finalize our income tax returns. Material changes to our tax accruals and uncertain tax positions may occur in the future based on audits, changes in legislation or resolution of pending matters.

In addition, material changes in our tax provision, tax accruals and uncertain tax positions could have a significant impact on our TRA liability. See TRA Liability, below.

TRA Liability

In connection with the IPO, we entered into a TRA which generally provides for the payment by us to each TRA Holder of 85% of the net cash savings, if any, in U.S. federal, state and local income tax and franchise tax that we actually realize (computed using simplifying assumptions to address the impact of state and local taxes) or are deemed to realize in certain circumstances in periods after the IPO as a result of certain increases in tax basis that occur as a result of our acquisition or Solaris LLC’s redemption, respectively, of all or a portion of such TRA Holder’s Solaris LLC units in connection with the IPO or pursuant to the exercise of a redemption right or call right. The estimated TRA liability totaled $98.9 million as of December 31, 2024.

At the time of conversion or redemption of Solaris LLC units, we recognize a corresponding TRA liability on the consolidated balance sheet based on the estimated undiscounted future payments under the TRA. The most significant estimates utilized by management to calculate the corresponding liability is our increase in tax basis related to exchanges, future cash tax savings rates, which are projected based on current tax laws and our historical and future tax profile, and the allocation of the liability between short-term and long-term based on when we expect to realize certain tax attributes.

81

Table of Contents

The calculation of the TRA liability is complex and data-intensive due to: 1) the intricacy of the provisions of the TRA; 2) historical tax data with asset step-ups in connection with previous acquisitions and/or equity offerings; 3) the need to make assumptions and allocations on an asset by asset basis for both the historical tax basis and the step-up tax basis due to transactions; 4) the need to identify the underlying attributes associated with numerous individual TRA Holders’ accounts in order to complete specific Legacy Owner calculations; and 5) various tax elections that can be made upon the filing of the tax return.

Therefore, the balance of the TRA liability resulting from the IPO and the subsequent redemptions of Solaris LLC units to Class A common stock during the years ended December 31, 2024 and 2023, which were recorded in additional paid-in-capital, may change substantially in the future as we refine our initial estimates and calculations and consider tax elections to be made as part of our tax return filings. Any changes in the balance of the TRA liability related to the IPO and subsequent redemptions of Solaris LLC units to Class A common stock will be recorded as adjustments to additional paid-in-capital. Additionally, subsequent changes in the TRA liability due to future redemptions of Solaris LLC units to shares of our Class A common stock will also be recorded as an adjustment to paid-in-capital. Future changes in the TRA liability due to changes in tax law and/or our historical and projected future tax profile will be recorded in earnings.

Emerging Growth Company Status

We are an “emerging growth company,” as defined in the JOBS Act, and we may take advantage of certain exemptions from various reporting requirements that are applicable to other public companies that are not “emerging growth companies.” We may take advantage of these exemptions until we are no longer an “emerging growth company.” Section 107 of the JOBS Act provides that an “emerging growth company” can take advantage of the extended transition period afforded by the JOBS Act for the implementation of new or revised accounting standards. We have elected to use the extended transition period for complying with new or revised accounting standards and as a result of this election, our consolidated financial statements may not be comparable to companies that comply with public company effective dates. We will remain an emerging growth company up until the last day of the fiscal year following the fifth anniversary of our IPO, or such earlier time that we have more than $1.235 billion of revenues in a fiscal year, have more than $700 million in market value of our common stock held by non-affiliates (and have been a public company for at least 12 months), or issue more than $1.0 billion of non-convertible debt over a three-year period.

Recent Accounting Pronouncements

See Part II, Item 8. Financial Statements and Supplementary Data ─ Note 2. Summary of Significant Accounting Policies.

Item 7A. Quantitative and Qualitative Disclosures About Market Risk

Market risk is the risk of loss arising from adverse changes in market rates and prices. Currently, our market risks relate to potential changes in the fair value of our long-term debt due to fluctuations in applicable market interest rates. Going forward our market risk exposure generally will be limited to those risks that arise in the normal course of business, as we do not engage in speculative, non-operating transactions, nor do we utilize financial instruments or derivative instruments for trading purposes.

Commodity Price Risk

The market for our services is indirectly exposed to fluctuations in the prices of crude oil and natural gas to the extent such fluctuations impact drilling and completion activity levels and thus impact the activity levels and timing of activity of our customers in the exploration and production and oilfield services industries.

A portion of our revenue is directly exposed to fluctuations in the price of crude oil because one of our largest customer contracts provides for rates that periodically fluctuate within a defined range in response to changes

82

Table of Contents

in WTI. According to the terms of the contract, the per barrel fee increases when WTI exceeds a certain base price. In addition, skim oil sales revenue is directly exposed to fluctuations in the price of crude oil.

We do not currently hedge our exposure to commodity price risk.

Interest Rate Risk

We are subject to interest rate risk on a portion of our long-term debt under the Credit Facility. As of December 31, 2024, we had $44.0 million of outstanding borrowings under our Credit Facility at a weighted-average interest rate of 7.408%. The outstanding borrowings under our Credit Facility generally bear a rate of interest at the SOFR plus 0.1% plus an alternative base rate spread and are therefore susceptible to interest rate fluctuations. A hypothetical one percentage point increase in interest rates on our borrowings outstanding under our Credit Facility at December 31, 2024 would increase our annual interest expense by approximately $0.4 million.

83

Table of Contents

Item 8. Financial Statements and Supplementary Data

INDEX TO CONSOLIDATED FINANCIAL STATEMENTS

Report of Independent Registered Public Accounting Firm (BDO USA, P.C.; Houston, Texas; PCAOB ID#243)

85

Consolidated Balance Sheets as of December 31, 2024 and 2023

86

Consolidated Statements of Operations for Each of the Years in the Three-Year Period Ended December 31, 2024

87

Consolidated Statements of Cash Flows for Each of the Years in the Three-Year Period Ended December 31, 2024

88

Consolidated Statements of Stockholders’ Equity for Each of the Years in the Three-Year Period Ended December 31, 2024

89

Notes to Consolidated Financial Statements

90

Note 1. Organization and Background of Business

90

Note 2. Summary of Significant Accounting Policies

91

Note 3. Additional Financial Statement Information

101

Note 4. Acquisitions

103

Note 5. Property, Plant and Equipment

104

Note 6. Intangible Assets

106

Note 7. Asset Retirement Obligations

107

Note 8. TRA Liability

107

Note 9. Debt

108

Note 10. Leases

110

Note 11. Income Taxes

113

Note 12. Stockholders’ Equity

116

Note 13. Commitments and Contingencies

117

Note 14. Earnings Per Share

118

Note 15. Stock-Based Compensation and Other Compensation Plans

119

Note 16. Related Party Transactions

121

84

Table of Contents

Report of Independent Registered Public Accounting Firm

Stockholders and Board of Directors

Aris Water Solutions, Inc.

Houston, Texas

Opinion on the Consolidated Financial Statements

We have audited the accompanying consolidated balance sheets of Aris Water Solutions, Inc. (the “Company”) as of December 31, 2024 and 2023, the related consolidated statements of operations, stockholders’ equity, and cash flows for each of the three years in the period ended December 31, 2024, and the related notes (collectively referred to as the “consolidated financial statements”). In our opinion, the consolidated financial statements present fairly, in all material respects, the financial position of the Company at December 31, 2024 and 2023, and the results of its operations and its cash flows for each of the three years in the period ended December 31, 2024, in conformity with accounting principles generally accepted in the United States of America.

Basis for Opinion

These consolidated financial statements are the responsibility of the Company’s management. Our responsibility is to express an opinion on the Company’s consolidated financial statements based on our audits. We are a public accounting firm registered with the Public Company Accounting Oversight Board (United States) (“PCAOB”) and are required to be independent with respect to the Company in accordance with the U.S. federal securities laws and the applicable rules and regulations of the Securities and Exchange Commission and the PCAOB.

We conducted our audits in accordance with the standards of the PCAOB. Those standards require that we plan and perform the audit to obtain reasonable assurance about whether the consolidated financial statements are free of material misstatement, whether due to error or fraud. The Company is not required to have, nor were we engaged to perform, an audit of its internal control over financial reporting. As part of our audits we are required to obtain an understanding of internal control over financial reporting but not for the purpose of expressing an opinion on the effectiveness of the Company’s internal control over financial reporting. Accordingly, we express no such opinion.

Our audits included performing procedures to assess the risks of material misstatement of the consolidated financial statements, whether due to error or fraud, and performing procedures that respond to those risks. Such procedures included examining, on a test basis, evidence regarding the amounts and disclosures in the consolidated financial statements. Our audits also included evaluating the accounting principles used and significant estimates made by management, as well as evaluating the overall presentation of the consolidated financial statements. We believe that our audits provide a reasonable basis for our opinion.

/s/ BDO USA, P.C.

We have served as the Company’s auditor since 2017.

Houston, Texas

February 27, 2025

85

Table of Contents

Aris Water Solutions, Inc.

Consolidated Balance Sheets

(in thousands, except for share and per share amounts)


December 31, 

December 31,


2024

2023

Assets


Cash

$

28,673

$

5,063

Accounts Receivable, Net

63,016

59,393

Accounts Receivable from Affiliate

12,016

22,963

Other Receivables

13,829

12,767

Prepaids and Deposits

10,418

8,364

Total Current Assets

127,952

108,550

Fixed Assets

Property, Plant and Equipment

1,188,781

1,041,703

Accumulated Depreciation

(160,176)

(121,989)

Total Property, Plant and Equipment, Net

1,028,605

919,714

Intangible Assets, Net

195,223

232,277

Goodwill

34,585

34,585

Deferred Income Tax Assets, Net

13,449

22,634

Operating Lease Right-of-Use Assets, Net

15,016

16,726

Other Assets

5,284

5,995

Total Assets

$

1,420,114

$

1,340,481

Liabilities and Stockholders' Equity

Accounts Payable

$

20,182

$

25,925

Payables to Affiliate

941

894

Insurance Premium Financing Liability

6,725

5,463

Accrued and Other Current Liabilities

77,339

64,416

Total Current Liabilities

105,187

96,698

Long-Term Debt, Net of Debt Issuance Costs

441,662

421,792

Asset Retirement Obligations

21,865

19,030

Tax Receivable Agreement Liability

98,781

98,274

Other Long-Term Liabilities

17,335

16,794

Total Liabilities

684,830

652,588

Commitments and Contingencies (see Note 13)

Stockholders' Equity

Preferred Stock $0.01 par value, 50,000,000 authorized. None issued or outstanding as of December 31, 2024 and December 31, 2023

Class A Common Stock $0.01 par value, 600,000,000 authorized, 31,516,468 issued and 30,857,526 outstanding as of December 31, 2024; 30,669,932 issued and 30,251,613 outstanding as of December 31, 2023

314

306

Class B Common Stock $0.01 par value, 180,000,000 authorized, 27,493,565 issued and outstanding as of December 31, 2024; 27,543,565 issued and outstanding as of December 31, 2023

274

275

Treasury Stock (at Cost), 658,942 shares as of December 31, 2024; 418,319 shares as of December 31, 2023

(8,988)

(5,133)

Additional Paid-in-Capital

343,342

328,543

Retained Earnings (Accumulated Deficit)

13,676

(87)

Total Stockholders' Equity Attributable to Aris Water Solutions, Inc.

348,618

323,904

Noncontrolling Interest

386,666

363,989

Total Stockholders' Equity

735,284

687,893

Total Liabilities and Stockholders' Equity

$

1,420,114

$

1,340,481

The accompanying notes are an integral part of these consolidated financial statements

86

Table of Contents

Aris Water Solutions, Inc.

Consolidated Statements of Operations

(in thousands, except for share and per share amounts)

Year Ended December 31, 


2024


2023

2022

Revenue

Produced Water Handling

$

226,089

$

195,207

$

151,360

Produced Water Handling — Affiliate

119,263

102,322

93,107

Water Solutions

62,942

66,625

60,672

Water Solutions — Affiliate

18,057

25,611

15,156

Other Revenue

9,093

2,353

706

Total Revenue

435,444

392,118

321,001

Cost of Revenue

Direct Operating Costs

178,396

177,973

139,480

Depreciation, Amortization and Accretion

79,159

76,632

67,524

Total Cost of Revenue

257,555

254,605

207,004

Operating Costs and Expenses

Abandoned Well Costs

518

1,303

15,771

General and Administrative

65,315

50,454

45,220

Impairment of Long-Lived Assets

15,597

Research and Development Expense

3,034

3,120

691

Other Operating Expense (Income), Net

2,269

(1,230)

2,212

Total Operating Expenses

71,136

53,647

79,491

Operating Income

106,753

83,866

34,506

Other Expense

Interest Expense, Net

36,233

32,853

29,185

Other

1

107

Total Other Expense

36,234

32,960

29,185

Income Before Income Taxes

70,519

50,906

5,321

Income Tax Expense

10,341

7,494

524

Net Income

$

60,178

$

43,412

$

4,797

Net Income Attributable to Noncontrolling Interest

33,321

24,524

3,097

Net Income Attributable to Aris Water Solutions, Inc.

$

26,857

$

18,888

$

1,700

Net Income Per Share of Class A Common Stock

Basic

$

0.81

$

0.59

$

0.04

Diluted

$

0.81

$

0.59

$

0.04

Weighted Average Shares of Class A Common Stock Outstanding

Basic

30,575,739

30,037,681

24,070,934

Diluted

30,877,637

30,037,681

24,146,215

The accompanying notes are an integral part of these consolidated financial statements

87

Table of Contents

Aris Water Solutions, Inc.

Consolidated Statements of Cash Flows

(in thousands)

Year Ended December 31, 


2024


2023


2022

Cash Flow from Operating Activities

Net Income

$

60,178

$

43,412

$

4,797

Adjustments to Reconcile Net Income to Net Cash Provided by Operating Activities

Deferred Income Tax Expense

8,689

7,299

466

Depreciation, Amortization and Accretion

79,159

76,632

67,524

Stock-Based Compensation

18,189

11,569

12,034

Impairment of Long-Lived Assets

15,597

Abandoned Well Costs

518

1,303

15,771

Loss (Gain) on Disposal of Assets, Net

102

(2,606)

478

Abandoned Projects

1,537

216

72

Amortization of Debt Issuance Costs, Net

2,949

2,280

2,143

Change in Payables Related to Tax Receivable Agreement Liability

229

413

Other

1,060

93

623

Changes in Operating Assets and Liabilities

Accounts Receivable

(4,202)

20,716

(38,811)

Accounts Receivable from Affiliate

10,947

23,104

(25,838)

Other Receivables

(859)

(9,648)

(838)

Prepaids and Deposits

(2,865)

(2,559)

238

Accounts Payable

(6,506)

3,937

1,903

Payables to Affiliates

47

(2,127)

1,522

Accrued Liabilities and Other

9,704

9,839

12,532

Net Cash Provided by Operating Activities

178,876

183,873

70,213

Cash Flow from Investing Activities

Property, Plant and Equipment Expenditures

(99,985)

(169,736)

(146,525)

Cash Paid for Asset Acquisitions

(46,104)

(5,100)

Proceeds from the Sale of Property, Plant and Equipment

519

20,154

14,700

Net Cash Used in Investing Activities

(145,570)

(149,582)

(136,925)

Cash Flow from Financing Activities

Dividends and Distributions Paid

(24,559)

(21,429)

(24,465)

Repurchase of Shares

(3,584)

(1,363)

(2,756)

Repayment of Credit Facility

(86,000)

(118,000)

Proceeds from Credit Facility

104,000

109,000

35,000

Payment of Debt Issuance Costs Related to Credit Facility

(3,942)

Proceeds from Insurance Premium Financing

8,779

6,636

Payment of Insurance Premium Financing

(7,779)

(1,252)

Payment of Finance Leases

(553)

Net Cash (Used in) Provided by Financing Activities

(9,696)

(30,350)

7,779

Net Increase (Decrease) in Cash

23,610

3,941

(58,933)

Cash, Beginning of Year

5,063

1,122

60,055

Cash, End of Year

$

28,673

$

5,063

$

1,122

Supplementary Cash Flow Data


Cash Paid for Interest, Net of Amount Capitalized

$

33,141

$

29,598

$

25,933

Cash Paid for Income Taxes

618

97

6

The accompanying notes are an integral part of these consolidated financial statements

88

Table of Contents

Aris Water Solutions, Inc.

Consolidated Statements of Stockholders’ Equity

(in thousands, except for share and per share amounts)

Class A

Class B

Additional

Retained Earnings

Non-

Total

Common Stock


Common Stock

Paid-in

Treasury Stock

(Accumulated

controlling

Stockholders'

Amount

Shares

Amount

Shares

Capital

Amount

Shares

Deficit)

Interests

Equity

Balance at December 31, 2021

$

218

21,858,022

$

317

31,716,104

$

212,926

$

(135)

10,191

$

(457)

$

389,670

$

602,539

Class A Shares Issued for Acquisitions

35

3,451,100

-

-

55,801

-

-

-

16,763

72,599

Redemption of Class B Shares for Class A Shares

41

4,140,585

(41)

(4,140,585)

52,433

-

-

-

(52,433)

-

Stock-based Compensation Expense

6

666,272

-

-

9,843

-

-

-

2,185

12,034

Increase in TRA Liability Related to Share Redemption

-

-

-

-

(23,970)

-

-

-

-

(23,970)

Deferred Tax Assets Acquired

-

-

-

-

12,512

-

-

-

-

12,512

Dividends and Distributions ($0.36 per share or unit)

-

-

-

-

-

-

-

(8,965)

(11,703)

(20,668)

Purchase of Treasury Stock

-

-

-

-

-

(2,756)

186,571

-

-

(2,756)

Net Income

-

-

-

-

-

-

-

1,700

3,097

4,797

Balance at December 31, 2022

$

300

30,115,979

$

276

27,575,519

$

319,545

$

(2,891)

196,762

$

(7,722)

$

347,579

$

657,087

Redemption of Class B Shares for Class A Shares

1

31,954

(1)

(31,954)

410

-

-

-

(410)

-

Stock-based Compensation Expense

5

521,999

-

-

9,070

-

-

-

2,494

11,569

Decrease in TRA Liability Related to Share Redemption, Net

-

-

-

-

119

-

-

-

-

119

Deferred Tax Liabilities Acquired, Net

-

-

-

-

(491)

-

-

-

-

(491)

Dividends and Distributions ($0.36 per share or unit)

-

-

-

-

-

-

-

(11,253)

(10,309)

(21,562)

Purchase of Treasury Stock

-

-

-

-

(110)

(2,242)

221,557

-

111

(2,241)

Net Income

-

-

-

-

-

-

-

18,888

24,524

43,412

Balance at December 31, 2023

$

306

30,669,932

$

275

27,543,565

$

328,543

$

(5,133)

418,319

$

(87)

$

363,989

$

687,893

Redemption of Class B Shares for Class A Shares

1

50,000

(1)

(50,000)

710

-

-

-

(710)

-

Stock-based Compensation Expense

7

796,536

-

-

15,015

-

-

-

3,167

18,189

Increase in TRA Liability Related to Share Redemption, Net

-

-

-

-

(411)

-

-

-

-

(411)

Deferred Tax Liabilities Acquired, Net

-

-

-

-

(497)

-

-

-

-

(497)

Tax-Related Partnership Distribution Payable

-

-

-

-

-

-

-

-

(1,340)

(1,340)

Dividends and Distributions ($0.405 per share or unit)

-

-

-

-

-

-

-

(13,094)

(11,779)

(24,873)

Purchase of Treasury Stock

-

-

-

-

(18)

(3,855)

240,623

-

18

(3,855)

Net Income

-

-

-

-

-

-

-

26,857

33,321

60,178

Balance at December 31, 2024

$

314

31,516,468

$

274

27,493,565

$

343,342

$

(8,988)

658,942

$

13,676

$

386,666

$

735,284

The accompanying notes are an integral part of these consolidated financial statements

89

Table of Contents

Aris Water Solutions, Inc.

Notes to Consolidated Financial Statements

1.Organization and Background of Business

Aris Water Solutions, Inc. (“Aris Inc.,” the “Company,” “we,” “our,” or “us”) is an independent, environmentally-focused company headquartered in Houston, Texas, that, through its controlling interest in Solaris Midstream Holdings, LLC, a Delaware limited liability company (“Solaris LLC”), provides sustainability-enhancing services to oil and natural gas operators. We strive to build long-term value through the development, construction and operation of integrated produced water handling and recycling infrastructure that provides high-capacity, comprehensive produced water management, recycling and supply solutions for operators in the Permian Basin.

We were incorporated on May 26, 2021 as a Delaware corporation and were formed to serve as the issuer in an initial public offering of equity (the “IPO”). Concurrent with the completion of the IPO, we became the new parent holding company of Solaris LLC.

As a holding company, our principal asset is a membership interest in Solaris LLC. As the sole managing member of Solaris LLC, we operate and control all of the business and affairs of Solaris LLC, and through Solaris LLC and its subsidiaries, conduct its business. We consolidate the financial results of Solaris LLC and report a noncontrolling interest related to the portion of Solaris LLC units not owned by us.

Amended and Restated Solaris LLC Agreement

On October 26, 2021, in connection with the IPO, the Solaris LLC Agreement was amended and restated (as so amended and restated, the “Solaris LLC Agreement”).

In accordance with the terms of the Solaris LLC Agreement, the holders of Solaris LLC units generally have the right to exchange their Solaris LLC units (and a corresponding number of shares of our Class B Common Stock), for shares of our Class A Common Stock at an exchange ratio of one share of Class A Common Stock for each Solaris LLC unit (and corresponding share of Class B Common Stock) exchanged, subject to conversion rate adjustments for stock splits, stock dividends and reclassifications.

Redemption Rights

Following the IPO, under the Solaris LLC Agreement, Legacy Owners of Solaris LLC units, subject to certain limitations, have the right, pursuant to a redemption right, to cause Solaris LLC to acquire all or a portion of their Solaris LLC units for, at Solaris LLC’s election, (x) shares of our Class A common stock at a redemption ratio of one share of Class A common stock for each Solaris LLC unit redeemed, subject to conversion rate adjustments for stock splits, stock dividends and reclassifications or (y) an equivalent amount of cash. Alternatively, upon the exercise of the redemption right, we have the right, pursuant to a call right, to acquire each tendered Solaris LLC unit directly from the Legacy Owner for, at our election, (x) one share of Class A common stock or (y) an equivalent amount of cash.

During the years ended December 31, 2024, 2023 and 2022, 50,000, 31,954 and 4,140,585 Solaris LLC units were converted (together with an equal number of shares of our Class B common stock) into shares of our Class A common stock, respectively. As of December 31, 2024, we own approximately 53% of Solaris LLC.

Corporate Reorganization

The transactions described above (altogether, the “Corporate Reorganization”) have been accounted for as a reorganization of entities under common control. As a result, our consolidated financial statements recognize the assets and liabilities received in the Corporate Reorganization at their historical carrying amounts, as reflected in the historical financial statements of Solaris LLC.

90

Table of Contents

2.Summary of Significant Accounting Policies

Basis of Presentation

Our consolidated financial statements have been prepared in accordance with U.S. generally accepted accounting principles (“GAAP”).

All dollar amounts, except per share/unit amounts, in the consolidated financial statements and tables in the notes are stated in thousands of dollars unless otherwise indicated.

Consolidation

We have determined that the members with equity at risk in Solaris LLC lack the authority, through voting rights or similar rights, to direct the activities that most significantly impact Solaris LLC’s economic performance; therefore, Solaris LLC is considered a variable interest entity (“VIE”). As the managing member of Solaris LLC, we operate and control all of the business and affairs of Solaris LLC, as well as have the obligation to absorb losses and the right to receive benefits that could be potentially significant to us. Therefore, we are considered the primary beneficiary and consolidate Solaris LLC.

The consolidated financial statements include the accounts of the Company, Solaris LLC and Solaris LLC’s wholly owned subsidiaries which include Solaris Water Midstream, LLC, Solaris Water Midstream Services, LLC, Solaris Midstream DB-TX, LLC, Solaris Midstream MB, LLC, Solaris Midstream DB-NM, LLC, Solaris Services Holdings, LLC, 829 Martin County Pipeline, LLC and Clean H2O Technologies, LLC (collectively, the “subsidiaries”). All material intercompany transactions and balances have been eliminated upon consolidation.

Noncontrolling Interest

Our consolidated financial statements include a noncontrolling interest representing the percentage of Solaris LLC units not held by Aris Inc.

Use of Estimates

Management has made certain estimates and assumptions that affect reported amounts in these consolidated financial statements and disclosures of contingencies. These estimates include, among others, determining the fair values of assets acquired, liabilities assumed, and/or contingent consideration paid in acquisitions or nonmonetary exchanges or disposed through sale, determining the fair value and related impairment of long-lived assets, determining the fair value of performance-based restricted stock units (“PSUs”), useful lives of property, plant and equipment and amortizable intangible assets, goodwill impairment testing, the fair value of asset retirement obligations (“ARO”), accruals for environmental matters, the income tax provision, valuation allowances for deferred tax assets and our Tax Receivable Agreement (“TRA”) liability.

Management evaluates estimates and assumptions on an ongoing basis using historical experience and other factors, including current economic and industry conditions. Actual results could differ from management’s estimates as additional information or actual results become available in the future, and those differences could be material.

Reclassification of Prior Year Presentation

Certain prior period amounts have been reclassified for consistency with the current period presentation. These reclassifications had no effect on the reported results of operations.

91

Table of Contents

Cash

We place our cash with financial institutions that are insured by the Federal Deposit Insurance Corporation; however, we maintain deposits in banks which exceed the amount of deposit insurance available. Management routinely assesses the financial condition of the institutions and believes that any possible credit loss would be minimal.

Accounts Receivable and Allowance for Credit Losses

Accounts receivable consists of trade receivables recorded at the invoice amount, plus accrued revenue that is earned but not yet billed, less an estimated allowance for credit losses. Accounts receivable are generally due within 60 days or less. Management determines the measurement of all expected credit losses for accounts receivable held at the reporting date based on historical experience, current conditions and reasonable and supportable forecasts. As of December 31, 2024 and 2023, the allowance for credit losses totaled zero. The “Accounts Receivable, Net” and “Accounts Receivable from Affiliate” balances were $81.7 million and $46.0 million, respectively, as of January 1, 2023.

Revenue Recognition

We generate revenue by providing services related to our Produced Water Handling and Water Solutions businesses. The services related to Produced Water Handling are fee-based arrangements and are based on the volume of water that flows through our systems and facilities. Services related to Water Solutions, including the sales of recycled produced water and groundwater, are priced based on negotiated rates with the customer.

We have customer contracts that contain minimum transportation and/or disposal volume delivery requirements, and we are entitled to deficiency payments if such minimum contractual volumes are not delivered by the customer. These deficiency amounts are based on fixed, daily minimum volumes (measured over monthly, quarterly or annual periods depending on the contract) at a fixed rate per barrel.

In determining the appropriate amount of revenue to be recognized as we fulfill our obligations under contracts, the following steps must be performed at contract inception: (i) identification of the promised goods or services in the contract; (ii) determination of whether the promised goods or services are performance obligations, including whether they are distinct in the context of the contract; (iii) measurement of the transaction price, including the constraint on variable consideration; (iv) allocation of the transaction price to the performance obligations; and (v) recognition of revenue when (or as) we satisfy each performance obligation.

For all of our produced water transfer and disposal contracts, revenue is recognized over time utilizing the output method based on the volume of wastewater accepted from the customer. We have determined that the performance obligation is satisfied over time as the customer simultaneously receives and consumes the benefits provided by performance of services, typically as customers’ wastewater is accepted. We typically charge customers a disposal and transportation fee on a per barrel basis according to the applicable contract.

For some contracts, we are entitled to shortfall payments if a customer does not deliver a contractually minimum volume of water for handling over a certain period. In these cases, we recognize volumes and the revenue for the difference between the physical volumes handled and the contractual minimum. Moreover, some contracts also have a mechanism that allows for shortfalls to be made up over a limited period of time. We had no long-term contract liabilities related to these contracts as of December 31, 2024 and 2023.

As part of our water processing activities, we aggregate and sell recovered crude oil, also known as skim oil. Included in our Produced Water Handling revenues is skim oil sales revenue, which is recognized when custody is transferred to the purchaser and sold at market rates, net of marketing costs. For the years ended

92

Table of Contents

December 31, 2024, 2023 and 2022, we recognized $41.9 million, $31.0 million and $24.7 million in skim oil sales revenue, respectively.

For contracts that involve sales of recycled produced water and groundwater, revenue is recognized at a point in time, based on when control of the product is transferred to the customer.

For contracts that involve construction or services provided to customers, we have determined the performance obligations are satisfied over time as the customer simultaneously receives and consumes the benefits provided by performance of services, and revenue is recognized as the services are performed. We allocate the consideration earned between the performance obligations based on the stand-alone selling price when multiple performance obligations are identified.

Property, Plant and Equipment

Property, plant and equipment is stated at cost, or at fair value for assets acquired in a business combination, less accumulated depreciation. Depreciation is provided on the straight-line method over the estimated useful service lives of the assets, as noted below:

Pipelines


30-50

years

Wells, Facilities, Water Ponds


25-30

years

Site Improvements and Other


15-30

years

Machinery and Equipment


15

years

Vehicles, Computers and Office Furniture


5-10

years

All costs necessary to place an asset into operation are capitalized. Maintenance and repairs are expensed when incurred. Upgrades and enhancements that substantially extend the useful lives of the assets or that substantially increase the capacity of the assets are capitalized. When property is abandoned, retired or otherwise disposed of, the cost and accumulated depreciation are removed from appropriate accounts and any gain or loss is included in earnings. Costs incurred for construction of facilities and related equipment and pipelines are included in construction in progress. Direct project costs on potential future projects are capitalized and included in construction in progress. These costs generally relate to acquiring the appropriate permits, rights-of-way and other related expenditures necessary prior to construction. No depreciation is recorded for these assets as they have not been placed in operation. See Note 5. Property, Plant and Equipment.

Capitalization of Interest

We capitalize interest costs associated with significant projects undergoing construction that is necessary to bring them to their intended use. Interest is capitalized using an interest rate equivalent to the weighted average interest rate we pay on long-term debt, including our Senior Sustainability-Linked Notes and Credit Facility. Capitalized interest is included in the cost of property, plant and equipment and depreciated with other costs on a straight-line basis.

Debt Issuance Costs

We capitalize costs incurred in connection with the issuance of debt and amortize such costs as additional interest expense over the term of the related debt.

Asset Retirement Obligations

Our ARO relate primarily to the dismantlement, removal, site reclamation and similar activities of our pipelines, water handling facilities and associated operations. The fair value of a liability for an ARO is recognized in the period in which it is incurred. These obligations are those for which we have a legal obligation for settlement. The fair value of the liability is added to the carrying amount of the associated asset.

93

Table of Contents

The significant unobservable inputs to this fair value measurement include estimates of plugging, abandonment and remediation costs, inflation rates, credit-adjusted risk-free rate and facilities lives. This additional carrying amount is then depreciated over the life of the asset. The liability increases due to the passage of time based on the time value of money until the obligation is settled. Subsequent adjustments in the cost estimate are reflected as revisions to the liability, and the amounts continue to be amortized over the useful life of the related asset. See Note 7. Asset Retirement Obligations.

Definite-Lived Intangible Assets

Substantially all of our intangible assets are related to customer contracts that were acquired in connection with previous acquisitions. Amortization of these assets is based primarily on the percentage of discounted cash flows expected to occur over the lives of the contracts. See Note 6. Intangible Assets.

Goodwill

Goodwill represents the excess of the purchase price of a business over the estimated fair value of the identifiable assets acquired and liabilities assumed. Goodwill is not amortized, but instead is tested for impairment on an annual basis, or when events or changes in circumstances indicate the fair value of the reporting unit may have been reduced below its carrying value. For our reporting unit, we perform a qualitative assessment of relevant events and circumstances about the likelihood of goodwill impairment. If it is deemed more likely than not that the fair value of the reporting unit is less than its carrying value, we calculate the fair value of the reporting unit. Otherwise, management concludes that no impairment has occurred, and further testing is not required. If the fair value of the reporting unit (including goodwill) is less than its carrying value, goodwill is considered to be impaired, and the goodwill balance is reduced by the difference between the fair value and the carrying value of the reporting unit.

Estimates and assumptions used to perform the impairment evaluation are inherently uncertain and can significantly affect the outcome of the analysis. The estimates and assumptions we use in the annual goodwill impairment assessment include market participant considerations and future forecasted operating results. Changes in operating results and other assumptions could materially affect these estimates.

We performed our annual goodwill impairment test using qualitative factors during the fourth quarter of 2024 and concluded there were no new impairment triggering events as of and for the year ended December 31, 2024. As such, there was no goodwill impairment as of December 31, 2024.

Impairment of Long-Lived Assets

Long-lived assets, such as property, plant, equipment and definite-lived intangible assets, are reviewed for impairment whenever events or changes in circumstances indicate that the carrying amount may not be recoverable. Individual assets are first grouped based on the lowest level for which identifiable cash flows are largely independent of the cash flows from other assets. Management then compares estimated future undiscounted cash flows expected to result from the use and eventual disposition of the asset group to its carrying amount. If the carrying amount is not recoverable, we would recognize an impairment loss equal to the amount by which the carrying amount exceeds fair value. Management estimates fair value based on projected future discounted cash flows. Fair value calculations for long-lived assets and intangible assets contain uncertainties because they require us to apply judgment and estimates concerning future cash flows, strategic plans, useful lives and market performance. We also apply judgment in the selection of a discount rate that reflects the risk inherent in the current business model. See Note 5. Property, Plant and Equipment.

Fair Value Measurements

Our financial assets and liabilities are to be measured using inputs from the three levels of the fair value hierarchy, of which the first two are considered observable and the last unobservable, which are as follows:

94

Table of Contents

Level 1—Inputs are unadjusted quoted prices in active markets for identical assets or liabilities that management has the ability to access at the measurement date;

Level 2—Inputs other than Level 1 that are observable, either directly or indirectly, such as quoted prices for similar assets or liabilities in active markets, quoted prices for identical or similar assets or liabilities in markets that are not active or other inputs corroborated by observable market data for substantially the full term of the assets or liabilities; and

Level 3—Unobservable inputs that reflect management’s assumptions that market participants would use in pricing assets or liabilities based on the best information available.

Fair Value on a Non-Recurring Basis

Nonfinancial assets and liabilities measured at fair value on a non-recurring basis include certain nonfinancial assets acquired and liabilities assumed in a business combination, shares/units granted in acquisitions and the initial recognition of ARO, for which fair value is used. These assets and liabilities are recorded at fair value when acquired/incurred but not re-measured at fair value in subsequent periods.

ARO estimates are derived from historical data as well as management’s expectation of future cost environments, scope of work and other unobservable inputs. As there is no corroborating market activity to support the assumptions used, management has designated these measurements as Level 3.

Additional Fair Value Disclosures

The fair value of our Senior Sustainability-Linked Notes, which are fixed-rate debt, is estimated based on the published market prices for the same or similar instruments. Management has designated this measurement as Level 2. The fair value of our Credit Facility approximates carrying value as the debt bears interest at a variable rate which is reflective of current rates otherwise available to us. Management has designated this measurement as Level 3. See Note 9. Debt.

Fair value information regarding our debt is as follows:

(in thousands)

December 31, 2024

December 31, 2023

Carrying

Fair

Carrying

Fair


Amount


Value


Amount


Value

Senior Sustainability-Linked Notes

$

400,000

$

400,516

$

400,000

$

405,090

Credit Facility

$

44,000

$

44,000

$

26,000

$

26,000

The carrying values of our financial instruments, consisting of cash, accounts receivable, accounts payable and our insurance premium financing liability, approximate their fair values due to the short maturity of such instruments.

Treasury Stock  

Purchase of treasury stock represents shares of our Class A common stock received by us from employees for the payment of withholding taxes due on shares of Class A common stock issued under our equity incentive plan (the “2021 Equity Incentive Plan”). We record treasury stock purchases at cost, which includes incremental direct transaction costs. Amounts are recorded as reductions in shareholders’ equity in the consolidated balance sheets. In connection with the assets acquired from Delaware Energy, as discussed below, certain shares of our Class A common stock issued to the seller were held in escrow and released to us under certain conditions, including for the reimbursement of certain post-acquisition workover costs pursuant to the terms of the asset purchase agreement. Upon release and return of these shares, they were recorded at their fair market value at the date of receipt. See Note 4. Acquisitions and Note 12. Stockholders’ Equity for more information.

95

Table of Contents

Transaction Costs

Transaction costs are comprised of acquisition-related expenses and are included in “Other Operating Expense (Income), Net.”

Research and Development Expense

Research and development expense is related to the development of technologies for the beneficial reuse of produced water and is expensed as incurred.

TRA Liability

We update our accrual for the TRA liability on a quarterly basis, based on current period conversions of Solaris LLC units, current estimates of taxable income and current income tax rates in effect at the time of the accrual. See Note 8. TRA Liability.

Income Taxes

Income tax expense included in our consolidated statements of operations for the years ended December 31, 2024, 2023 and 2022 is calculated based only on our allocable share of income (loss) of Solaris LLC, which is taxed as a partnership. We recognize the amount of taxes payable or refundable for the current year and deferred tax assets and liabilities for the future tax consequences of events that have been recognized in our consolidated financial statements or tax returns. We measure current and deferred tax assets and liabilities based on provisions of enacted tax law. We evaluate the realization of our deferred tax assets based on all available evidence and establish a valuation allowance to reduce deferred tax assets when it is more likely than not that they will not be realized.

We recognize the tax benefit from an uncertain tax position only if it is more likely than not that the tax position will be sustained on examination by the taxing authorities, based on the technical merits of the tax position.

Our policy is to recognize accrued interest and penalties related to uncertain tax positions in “Other” expense in the consolidated statements of operations. At December 31, 2024 and 2023, there were no liabilities recorded for payment of interest and penalties associated with uncertain tax positions. See Note 11. Income Taxes.

Stock-Based Compensation

Restricted stock and restricted stock units (collectively “RSUs”) and performance-based restricted stock units (“PSUs”) issued to employees and directors are recorded on grant-date at fair value. Expense is recognized on a straight-line basis over the employee’s and director’s requisite service period (generally the vesting period of the award) as either operating expense or general and administrative expense in the consolidated statements of operations. We have elected to account for forfeitures as they occur. Therefore, compensation cost previously recognized for an award that is forfeited because of a failure to satisfy a service condition will be reversed in the period of the forfeiture. See Note 15. Stock-Based Compensation and Other Compensation Plans.

Earnings Per Share Attributable to Aris Inc.

We use the two-class method to give effect to participating securities in periods in which there is net income. Basic earnings per share (“EPS”) of our Class A common stock is computed on the basis of the weighted average number of shares outstanding during each period. The diluted EPS of our Class A common stock includes the effect of outstanding common stock equivalents, except in periods in which there is a net loss. In

96

Table of Contents

the event of a net loss, we exclude the effect of outstanding common stock equivalents from the calculation of diluted EPS as the inclusion would be anti-dilutive.

In addition, although we include shares of restricted stock granted to members of our Board of Directors in our count of Class A common stock outstanding, we exclude those shares of restricted stock from our EPS calculation because vesting of the restricted stock is contingent upon continued service as Board members.

Acquisitions

To determine if a transaction should be accounted for as a business combination or an acquisition of assets, we first calculate the relative fair values of the assets acquired. If substantially all of the relative fair value is concentrated in a single asset or group of similar assets, or, if not, but the transaction does not include a significant process (does not meet the definition of a business), the transaction is recorded as an acquisition of assets. For acquisitions of assets, the purchase price is allocated based on the relative fair values, and no goodwill is recorded. All other transactions are recorded as business combinations. We record the assets acquired and liabilities assumed in a business combination at their acquisition date fair values. Transactions in which we acquire control of a business are accounted for under the acquisition method. The identifiable assets, liabilities and any noncontrolling interests are recorded at the estimated fair value as of the acquisition date. The purchase price in excess of the fair value of assets acquired and liabilities assumed is recorded as goodwill. See Note 4. Acquisitions.

Environmental Matters

We are subject to various federal, state and local laws and regulations relating to the protection of the environment. Management has established procedures for the ongoing evaluation of our operations to identify potential environmental exposures and to comply with regulatory policies and procedures. Environmental expenditures that relate to current operations are expensed or capitalized as appropriate. Expenditures that relate to an existing condition caused by past operations and do not contribute to current or future revenue generation are expensed as incurred. Liabilities are recorded, on an undiscounted basis, when environmental costs are probable and the costs can be reasonably estimated. We maintain insurance which may cover in whole or in part certain environmental expenditures. See Note 13. Commitments and Contingencies.

Segment Information

Operating segments are identified as components of an enterprise about which separate, discrete financial information is available for evaluation by the chief operating decision maker, or decision-making group, in making decisions on how to allocate resources and assess performance. Our chief operating decision maker (“CODM”) is the Chief Executive Officer, who reviews operating results to make decisions about allocating resources and assessing performance for the entire Company as one consolidated operating and reportable segment.

We view our operations and manage the business as one operating segment, as the assets support all revenue streams. We manage our business through a single operating segment comprising two primary revenue streams, Produced Water Handling and Water Solutions. Our Produced Water Handling revenue is driven by the volumes of produced water we gather from our customers, and our Water Solutions revenue is driven by the quantities of recycled produced water and groundwater delivered to our customers to support their well completion activities in the Permian Basin. The CODM assesses performance for the entire Company and decides how to allocate resources based on consolidated net income that also is reported on the consolidated statements of operations as consolidated net income. The CODM also uses results based on consolidated net income to evaluate income generated from segment assets in deciding how to allocate resources. Results based on consolidated net income are used to monitor budget versus actual results. We do not have intra-entity sales or transfers. The measure of segment assets is reported on the balance sheet as total consolidated assets, and all of our assets reside in the United States. Significant expenses provided

97

Table of Contents

to and reviewed by the CODM primarily include Direct Operating Costs and General and Administrative Expenses, which are included on the consolidated statements of operations. Since we operate as one consolidated operating and reportable segment, all financial information required by ASU 2023-07, Segment Reporting (Topic 280): Improvements to Reportable Segment Disclosure, can be found in the accompanying financial statements.

Leases

We determine whether an arrangement contains a lease based on the conveyed rights and obligations at the inception date. If an agreement contains an operating or finance lease, at the commencement date, we record a Right-of-Use Asset and a corresponding lease liability based on the present value of the minimum lease payments.

As most of our leases do not provide an implicit borrowing rate, to determine the present value of lease payments, we use our hypothetical secured borrowing rate based on information available at lease commencement.

Lease Term ─ Leases with an initial term of 12 months or less are not recorded on the balance sheet, and we recognize lease expense for these leases on a straight-line basis over the lease term. Most leases include one or more options to renew, with renewal terms that can extend the lease term from one month to one year or more. Additionally, some of our leases include an option for early termination. We include renewal periods and exclude termination periods from our lease term if, at commencement, it is reasonably likely that we will exercise the option.

Lease Payments ─ Certain of our lease agreements include rental payments that are adjusted periodically for inflation or passage of time. These step payments are included within our present value calculation as they are known adjustments at commencement. Some of our lease agreements, including sublease agreements, include variable payments that are excluded from our present value calculation.

Additionally, we have lease agreements that include lease and non-lease components, such as equipment maintenance, which are generally accounted for as a single lease component. For these leases, lease payments include all fixed payments stated within the contract. For real estate lease agreements, including our sublease agreements, we account for lease and non-lease components separately. Our lease agreements do not contain any material residual value guarantees that would impact our lease payments. See Note 10. Leases.

Collaborative Arrangements

In November 2022, we announced that we had entered into a Joint Industry Project (the “JIP”) with Chevron U.S.A. Inc. and ConocoPhillips to develop and pilot technologies and processes to treat produced water for potential beneficial reuse opportunities. In January 2023, ExxonMobil Corporation joined the JIP, and in July 2024, Coterra Energy Inc. joined the JIP. We are leading the engineering, construction and execution of the testing protocols and pilot projects, while leveraging the combined technical expertise of Chevron U.S.A., ConocoPhillips, ExxonMobil and Coterra Energy Inc (collectively with us, the “alliance members”).

The JIP is accounted for as a collaborative arrangement pursuant to Accounting Standards Codification 808, “Collaborative Arrangements” (“ASC 808”), as the arrangement involves a joint operating activity pursuant to which Aris Inc. is an active participant and is exposed to significant risks and rewards dependent on the commercial success of the activity. ASC 808 describes arrangements within its scope and considerations surrounding presentation and disclosure, with recognition matters subjected to other authoritative guidance, in certain cases by analogy. We have concluded that ASC 730, “Research and Development,” should be applied to the JIP.

98

Table of Contents

We account for reimbursements of research and development costs under the JIP as contra-expenses in the period such expenses are incurred. This reflects the joint risk sharing nature of these activities within the collaborative arrangement. We classify advance billings or receivables recorded as “Accrued and Other Current Liabilities” or “Other Receivables,” respectively, on our consolidated balance sheet.

For the years ended December 31, 2024, 2023 and 2022, we incurred $8.9 million, $6.4 million and $0.1 million, respectively, in total research and development expenses relating to the JIP, which was offset by $7.4 million, $4.8 million and $68 thousand, respectively, in amounts due from the other alliance members for reimbursement of these shared costs and is included in “Research and Development Expense” on the consolidated statements of operations. As of December 31, 2024 and 2023, we recorded $0.2 million and $1.4 million, respectively, due from the other alliance members for reimbursement of shared costs in “Other Receivables” on the consolidated balance sheet and $0.4 million and $1.1 million, respectively, in related advance billings included in “Accrued and Other Current Liabilities” on the consolidated balance sheet. See Note 3. Additional Financial Statement Information.

Cloud Computing Arrangements

During the fourth quarter of 2023, we began the process of implementing a new enterprise resource planning system. Based on the provisions of ASU 2018-15, Intangibles - Goodwill and Other - Internal-Use Software, we may capitalize certain implementation costs associated with hosting arrangements that are service contracts. The capitalized costs are amortized over the term of the hosting arrangement, commencing when the capitalized asset is ready for its intended use. Costs related to preliminary project activities and post-implementation activities are expensed as incurred. Accordingly, we capitalized a total of $2.3 million in implementation costs incurred during the development phase and began amortizing such costs in the third quarter of 2024. We amortized $0.4 million of implementation costs during the year ended December 31, 2024, which are included in “General and Administrative” expenses on the consolidated statements of operations. As of December 31, 2024, $1.9 million of implementation costs remain to be amortized, of which $0.8 million and are included in “Prepaids and Deposits” and $1.1 million are included in “Other Assets” on the consolidated balance sheet.

Financing Receivable

In the third quarter of 2024, we finalized an agreement with a third party to construct and operate a water separation facility on its behalf. The amount due for the construction costs is treated as a financing receivable and is reported on our consolidated balance sheet at its amortized cost. The amortized cost basis is the amount at which a financing receivable or investment is originated or acquired, adjusted for applicable accrued interest, accretion, or amortization of premium, discount, and net deferred fees or costs, or other adjustments. Interest income is recognized based on the contractual rate in the loan agreement and any premium/discount is amortized to interest income using the effective interest rate method.

As of December 31, 2024, the remaining discounted balance due from the third party was $3.2 million and is included in “Other Receivables” on the consolidated balance sheet. Income related to services performed to operate the facility is recorded in “Other Revenues.” The Company does not currently maintain a loan loss allowance as it does not anticipate future losses.

Recently Adopted Accounting Pronouncements

In November 2023, the Financial Accounting Standards Board (“FASB”) issued Accounting Standards Update (“ASU”) issued ASU 2023-07 Segment Reporting (Topic 280): Improvements to Reportable Segment Disclosures. The ASU improves reportable segment disclosure requirements, primarily through enhanced disclosures about significant segment expenses. The amendments in this ASU require disclosure of incremental segment information on an annual and interim basis for all public entities to enable investors to develop more decision-useful financial analyses. This ASU is effective for annual periods beginning after December 15, 2023 and should be applied prospectively. We adopted this accounting pronouncement in

99

Table of Contents

January 2024, and other than the required disclosures, adopting this accounting standard did not have a material impact on the consolidated financial statements.

In September 2022, the FASB issued ASU 2022-04 Liabilities-Supplier Finance Programs (Topic 405): Disclosure of Supplier Finance Program Obligations. Amendments in this update require annual and interim disclosure of the key terms of outstanding supplier finance programs and a rollforward of the related obligations. These amendments do not affect the recognition, measurement or financial statement presentation of the supplier finance program obligations. The amendments are effective retrospectively for fiscal years beginning after December 15, 2022, except for the rollforward requirements, which are effective for fiscal years beginning after December 15, 2023. We adopted this accounting pronouncement, except for the disclosure of rollforward activity, in December 2023, in connection with the execution of a short-term agreement to finance certain insurance premiums. We adopted the rollforward requirements in December 2024. See Note 9. Debt.

Recent Accounting Pronouncements

The Company is an “emerging growth company”, as defined in the JOBS Act. Under the JOBS Act, emerging growth companies can delay adopting new or revised accounting standards issued subsequent to the enactment of the JOBS Act until those standards apply to private companies. We have elected to use this extended transition period for complying with new or revised accounting standards that have different effective dates for public and private companies until the earlier of the date that we (i) are no longer an emerging growth company or (ii) affirmatively and irrevocably opt out of the extended transition period provided in the JOBS Act. As a result, our consolidated financial statements may not be comparable to companies that comply with the new or revised accounting pronouncements as of public company effective dates.

In November 2024, the FASB issued ASU 2024-03 Income Statement-Reporting Comprehensive Income-Expense Disaggregation Disclosures (Subtopic 220-40): Disaggregation of Income Statement Expenses. The amendments in this ASU require public business entities to disclose in the notes to the financial statements, among other things, specific information about certain costs and expenses including purchases of inventory, employee compensation and depreciation, amortization and depletion expenses for each caption on the income statement where such expenses are included. Additionally, the amendments also require more granular disclosure regarding total selling expenses and an entity's definition of those expenses. This ASU was updated in January 2025, under ASU 2025-01 Income Statement-Reporting Comprehensive Income-Expense Disaggregation Disclosures (Subtopic 220-40): Clarifying the Effective Date to clarify that this ASU is effective for annual periods beginning after December 15, 2026 and interim reporting periods within annual reporting periods beginning after December 15, 2027 and may be applied prospectively or retrospectively. We are currently assessing the impact of this standard on our consolidated financial statements and related disclosures.

In December 2023, the FASB issued ASU 2023-09 Income Taxes (Topic 740): Improvements to Income Tax Disclosures. The amendments in this ASU primarily relate to the rate reconciliation and income taxes paid disclosures and improve the transparency of income tax disclosures by requiring (1) consistent categories and greater disaggregation of information in the rate reconciliation and (2) income taxes paid disaggregated by jurisdiction. This ASU is effective for annual periods beginning after December 15, 2024 and may be applied prospectively or retrospectively. Other than the required disclosures, we do not expect a material impact on the consolidated financial statements and related disclosures upon adoption.

100

Table of Contents

3.Additional Financial Statement Information

Balance Sheet

Other Balance Sheet information is as follows:

(in thousands)


December 31, 

December 31,


2024

2023

Other Receivables

Insurance and Third Party Receivables for Remediation Expenses

$

5,149

$

4,064

Reimbursable Research and Development Receivable

207

1,450

Property Insurance Receivable

2,337

4,000

Financing Receivable

3,242

Reimbursable Projects

2,894

3,253

Total Other Receivables

$

13,829

$

12,767

Prepaids and Deposits

Prepaid Insurance

$

7,257

$

5,494

Other Prepaids and Deposits

3,161

2,870

Total Prepaids and Deposits

$

10,418

$

8,364

Accrued and Other Current Liabilities

Accrued Operating Expense

$

28,897

$

33,491

Accrued Capital Costs

4,023

3,812

Accrued Interest

8,067

8,510

Accrued Compensation

12,651

10,118

Accrued General and Administrative Expense

2,244

1,030

Sales Tax Payable

12,721

1,645

Operating Lease Liabilities

1,568

1,676

Finance Lease Liabilities

571

Contingent Consideration Liability

1,024

1,221

Advance Billings for Reimbursable Research and Development Expense

431

1,120

Tax-Related Partnership Distribution Payable

1,340

Other

3,802

1,793

Total Accrued and Other Current Liabilities

$

77,339

$

64,416

Other Long-Term Liabilities

Noncurrent Operating Lease Liabilities

$

14,040

$

14,716

Noncurrent Finance Lease Liabilities

1,747

Contingent Consideration Liability

1,548

2,078

Total Other Long-Term Liabilities

$

17,335

$

16,794

101

Table of Contents

Statement of Operations

Other Statement of Operations information is as follows:

(in thousands)

Year Ended December 31, 


2024


2023


2022

Depreciation, Amortization and Accretion

Depreciation - Property, Plant and Equipment

$

40,566

$

37,859

$

30,254

Amortization - Intangible Assets

37,053

37,569

36,735

Accretion of Asset Retirement Obligations

1,369

1,204

535

Amortization of Finance Right-of-Use Assets

171

Total Depreciation, Amortization and Accretion

$

79,159

$

76,632

$

67,524

Other Operating Expense (Income), Net

Loss (Gain) on Disposal of Asset, Net

$

102

$

(2,606)

$

478

Transaction Costs

997

802

1,520

Abandoned Projects

1,537

$

216

$

72

Other

(367)

358

142

Total Other Operating Expense (Income), Net

$

2,269

$

(1,230)

$

2,212

Interest Expense, Net

Interest on Debt Instruments

$

34,481

$

34,639

$

31,609

Amortization of Debt Issuance Costs

3,057

2,590

2,440

Interest on Finance Lease Obligations

40

Total Interest Expense

37,578

37,229

34,049

Less: Capitalized Interest

(1,345)

(4,376)

(4,864)

Total Interest Expense, Net

$

36,233

$

32,853

$

29,185

Significant Customers

Customers that comprised more than 10% of our total revenue are as follows:

Year Ended December 31, 


2024


2023


2022


ConocoPhillips

32

%

33

%

34

%

Chevron U.S.A. Inc.

21

%

18

%

11

%

Mewbourne Oil Company

**

%

11

%

12

%

**

Revenue was less than 10% of total revenue.

As of December 31, 2024, ConocoPhillips accounted for 16% and Chevron U.S.A. Inc. accounted for 34% of accounts receivable. As of December 31, 2023, ConocoPhillips accounted for 28% and Chevron U.S.A. Inc. accounted for 27% of accounts receivable.

102

Table of Contents

Supplemental Non-Cash Disclosure

Significant non-cash activity for the years ended December 31, 2024, 2023 and 2022 is discussed in the following locations:

Non-Cash Item

Location

Non-Cash Investing and Financing Activities:

Shares of Class A Common Stock Issued in Acquisition

Note 4. Acquisitions

Accrued Additions to Property, Plant and Equipment

Note 5. Property, Plant and Equipment

Asset Retirement Obligations

Note 7. Asset Retirement Obligations

Increase in TRA Liability Related to Share Redemption

Note 8. TRA Liability

Right-of-Use Assets Obtained in Exchange for Operating and Finance Lease Liabilities, Net

Note 10. Leases

Treasury Stock Reimbursement

Note 12. Stockholders' Equity

4.Acquisitions

Surface Acreage Acquisition

In November 2024, we purchased approximately 45,000 surface acres (unaudited) and site improvements (referred to as the “McNeill Ranch Acquisition”) in New Mexico and Texas for total cash consideration of $46.1 million, inclusive of transaction costs, to secure potential disposal capacity for long-term growth. This purchase was considered an asset acquisition, and the allocation of assets consisted of $43.2 million to land and $2.9 million to site improvements and other.

Crosstek Acquisition

In February 2025, we acquired intellectual property rights and assets from Crosstek Membrane Technology LLC to help us accelerate our entry into broader industrial markets, including industrial water and wastewater treatment. In connection with the closing and as consideration for the business, we paid the seller $2.0 million in cash and included sales-based contingent consideration with a cap of $1.0 million to be paid over a four-year contractual period.

Delaware Energy Asset Acquisition

On August 1, 2022, we acquired from Delaware Energy, LLC (“Delaware Energy”) certain produced water handling facilities and other related assets and rights in Lea County and Eddy County, New Mexico. In connection with the closing and as consideration for the assets, we issued to the seller 3,365,907 shares of our Class A common stock and included volumetric-based contingent consideration. We estimated the fair value of the contingent consideration using a discounted cash flow model based on estimated royalty payments to be made over a five-year contractual period. Allocation of the purchase price to the acquired assets was based on relative fair values.

103

Table of Contents

The following table sets forth our purchase price allocation:

(in thousands, except share and per share amounts)

Equity Consideration

Number of Class A Shares Issued (1)

3,365,907

Fair Value Per Share on Transaction Closing Date

$

21.16

Total Fair Value of Equity Consideration

$

71,223

Fair Value of Contingent Consideration (2)

3,899

Total Fair Value of Consideration

$

75,122

Purchase Price Allocation

Produced Water Handling Facilities

$

72,736

Gathering Systems and Pipelines

2,716

Total Fair Value of Property Acquired

75,452

Less: ARO Liabilities Assumed

(330)

Total Purchase Price Allocation

$

75,122

(1)A portion of these shares were held in escrow and released pursuant to the terms and conditions of the asset purchase agreement with Delaware Energy. During the years ended December 31, 2024 and 2023, 23,107 and 85,471, respectively, of these shares were released and returned to the Company for the reimbursement of certain post-acquisition workover costs. As of March 31, 2024, there were no remaining shares left in escrow. See Note 12. Stockholders’ Equity for further details.
(2)As of December 31, 2024 and 2023, liabilities for contingent consideration of $1.0 million and $1.2 million, respectively, are included in “Accrued and Other Current Liabilities,” on the consolidated balance sheet, and liabilities for contingent consideration of $1.5 million and $2.1 million, respectively, are included in “Other Long-Term Liabilities,” on the consolidated balance sheet.

Contemporaneously with the issuance of the shares of Class A common stock to Delaware Energy, Solaris LLC issued 3,365,907 Solaris LLC units to Aris Inc.

Water Standard Asset Acquisition

In October 2022, we acquired certain intellectual property rights and related proprietary treatment technologies and assets from Water Standard Management (US), Inc. (“Water Standard”) that will support and accelerate the advanced treatment and beneficial reuse of produced water in the Permian Basin. In connection with the closing and as consideration for the assets, we issued the seller 85,193 shares of our Class A common stock, which was valued on the acquisition date at $16.16 per share for total equity consideration of $1.4 million. We also paid the seller $1.2 million in cash for total consideration of $2.6 million. Contemporaneously with the issuance of the shares of Class A common stock to the seller, Solaris LLC issued 85,193 Solaris LLC units to Aris Inc.

Other Asset Acquisitions During the Year Ended December 31, 2022

During the second half of 2022, we purchased six ponds from ConocoPhillips, a related party, for a cash purchase price of $3.9 million.

5.Property, Plant and Equipment

Property, plant and equipment (“PP&E”) is stated at cost, less accumulated depreciation. Depreciation is calculated on a straight-line basis over the estimated useful service life of the asset.

104

Table of Contents

PP&E consists of the following:

(in thousands)


December 31, 

December 31,


2024

2023

Wells, Facilities, Water Ponds and Related Equipment

$

626,182

$

561,059

Pipelines

460,455

427,528

Vehicles, Equipment, Site Improvements and Other

30,375

24,496

Assets Subject to Depreciation

1,117,012

1,013,083

Land

43,618

463

Projects and Construction in Progress

28,151

28,157

Total Property, Plant and Equipment

1,188,781

1,041,703

Accumulated Depreciation

(160,176)

(121,989)

Total Property, Plant and Equipment, Net

$

1,028,605

$

919,714

Accrued PP&E additions totaled $14.2 million, $13.1 million and $26.4 million at December 31, 2024, 2023 and 2022, respectively.

Assets Sold and Asset Impairment

During the third quarter of 2023, we closed the sale of certain assets and received cash consideration of $20.1 million. We recorded a gain of $2.6 million, which is included in “Other Operating Expense (Income), Net” in the consolidated statements of operations for the year ended December 31, 2023. No impairment was recorded during the year ended December 31, 2023.

During the first quarter of 2022, management committed to a plan to sell certain assets located in the Midland Basin and determined that these assets met all the criteria for classification as assets held for sale. These assets were re-measured at their fair values less costs to sell, which resulted in the recognition of pre-tax impairment expense of $15.6 million during the first quarter of 2022. We estimated the fair value of the assets using indicative bids, which were representative of a Level 2 fair value measurement, and we ceased recording depreciation on the assets. During the third quarter of 2022, we closed the sale of these assets for proceeds of $7.4 million and recorded a gain of $0.1 million. We also disposed of other assets during the year ended December 31, 2022 for which we received $7.3 million in cash and recognized a de minimis gain.

Abandoned Assets

Total abandonment expense for the years ended December 31, 2024, 2023 and 2022 was $0.5 million, $1.3 million and $15.8 million, respectively, and primarily related to the following:

In the third quarter of 2023, management determined a stand-alone produced water handling facility was no longer economically beneficial to the operations of the Company and should be shut-in and taken out of service. Accordingly, we removed the costs and the associated accumulated depreciation and recognized a $1.2 million charge for the remaining book value of the asset. This charge is included in “Abandoned Well Costs” in the consolidated statements of operations for the year ended December 31, 2023.

In the second quarter of 2022, management determined that two previously acquired facilities were no longer economically beneficial to the operations of the Company due to required workover costs and should be shut-in and taken out of service. Management also determined that a well under construction in Texas needed to be abandoned after the well had encountered technical difficulties during the drilling phase and progress on the well had ceased. Management’s evaluation of these assets determined that abandoning the assets was the most prudent course of action. Accordingly, we removed the costs and the associated accumulated depreciation of the assets and recognized an abandonment charge of $5.8 million for the remaining book value.

105

Table of Contents

In the third quarter of 2022, we recognized an abandonment charge of $9.2 million related to a stand-alone produced water handling facility that was taken out of service.

In the fourth quarter of 2022, we commenced the retirement work on several salt water disposal (“SWD”) wells that had previously been taken out of service and had their costs removed. In connection with this work, we revised the asset retirement obligation related to these SWD wells to reflect the estimated cost of the retirement work. The resulting charge of $1.1 million was recorded to abandoned well costs.

Abandoned Projects

During the year ended December 31, 2024, we recorded $1.5 million in abandoned project expense related to abandoned projects and the write-off of permits for water handling facilities and right-of-way easements that either expired prior to use or that we no longer planned to use for future projects.

We recognized $0.2 million and $0.1 million of abandoned project expense during the years ended December 31, 2023 and 2022, respectively.

Abandoned project expense is recorded in “Other Operating Expense (Income), Net” in the consolidated statements of operations. The amount of expense recorded during each year was equal to the recorded cost for each of the assets. No accumulated depreciation was recorded related to these assets.

6.Intangible Assets

All of our intangible assets are subject to amortization and substantially all are related to customer contracts acquired through acquisitions. The components of the intangible assets are as follows:

(in thousands)


December 31, 

December 31,


2024

2023

Gross Value

$

366,683

$

366,683

Accumulated Amortization

(171,460)

(134,406)

Net Carrying Value

$

195,223

$

232,277

Substantially all of the net carrying value of our intangible assets is attributable to contracts that expire in 2035.

The table below shows the expected amortization of intangible assets as of December 31, 2024:

(in thousands)


Amount

2025

$

35,215

2026

32,123

2027

27,893

2028

23,190

2029

18,648

Thereafter

58,154

Amortization expense totaled $37.1 million, $37.6 million and $36.7 million for the years ended December 31, 2024, 2023 and 2022, respectively.

106

Table of Contents

7.Asset Retirement Obligations

Our AROs are related primarily to the dismantlement, removal, site reclamation and similar activities of our pipelines, water handling facilities and associated operations. A reconciliation of the changes in AROs is as follows:

(in thousands)

Year Ended December 31,


2024

2023

Asset Retirement Obligations, Beginning Balance

$

19,793

$

19,785

Liabilities Incurred

1,615

930

Accretion Expense

1,369

1,204

Reduction for Assets Sold

(554)

Liabilities Settled

(675)

(2,056)

Revision of Estimates

484

Asset Retirement Obligations, Ending Balance

$

22,102

$

19,793

8.TRA Liability

At the closing of the IPO, we entered into a Tax Receivable Agreement, or TRA, with the Legacy Owners of Solaris LLC units (each such person, a “TRA Holder,” and together, the “TRA Holders”). The TRA generally provides for the payment by us to each TRA Holder of 85% of the net cash savings, if any, in U.S. federal, state and local income tax and franchise tax that we actually realize (computed using simplifying assumptions to address the impact of state and local taxes) or, are deemed to realize in certain circumstances, in periods after the IPO as a result of certain increases in tax basis that occur as a result of our acquisition or Solaris LLC’s redemption, respectively, of all or a portion of such TRA Holder’s Solaris LLC units in connection with the IPO or pursuant to the exercise of a redemption right or call right. We retain the remaining 15% of these cash savings.

A reconciliation of the changes in the TRA liability is as follows:

(in thousands)

Year Ended December 31,


2024

2023

TRA Liability, Beginning Balance

$

98,274

$

97,980

Increase in TRA Liability Related to Current Year Share Redemption

411

232

Change in Payables Related to TRA Liability

229

413

Adjustments Reflected in 2022 Federal Income Tax Return

(351)

TRA Liability, Ending Balance

$

98,914

$

98,274

The calculation of the TRA liability is complex and data-intensive due to: 1) the intricacy of the provisions of the TRA; 2) historical tax data with asset step-ups in connection with previous acquisitions and/or equity offerings; 3) the need to make assumptions and allocations on an asset by asset basis for both the historical tax basis and the step-up tax basis due to transactions; 4) the need to identify the underlying attributes associated with numerous individual TRA Holders’ accounts in order to complete specific Legacy Owner calculations; and 5) various tax elections that can be made upon the filing of our tax returns.

Therefore, the balance of the TRA liability resulting from the IPO and the subsequent redemptions of Solaris LLC units to Class A common stock, which were recorded in additional paid-in-capital, may change substantially in the future as we refine our initial estimates and calculations and consider tax elections to be made as part of our tax return filings for the 2024 tax year to be made later in 2025. Any change in the balance of the TRA liability related to the IPO and subsequent redemptions of Solaris LLC units to Class A common stock will be recorded as an adjustment to additional paid-in-capital. Additionally, subsequent changes in the TRA liability due to future redemptions of Solaris LLC units to shares of our Class A common stock will also be recorded as an adjustment to additional paid-in-capital. Future changes in the TRA liability due to changes in tax law and/or our historical and projected future tax profile will be recorded in earnings.

107

Table of Contents

As of December 31, 2024 and 2023, the estimated TRA liability totaled $98.9 million and $98.3 million, respectively, of which $0.1 million was recorded in “Accrued and Other Current Liabilities” as of December 31, 2024. There was no related current liability as of December 31, 2023. The increase to the TRA liability is related to the redemption of Class B common shares to Class A common shares, which increased the liability $0.4 million, and a state tax rate change, which increased the liability $0.2 million.

If we experience a change of control (as defined under the TRA, which includes certain mergers, asset sales and other forms of business combinations and change of control events) or the TRA terminates early (at our election or as a result of our breach), we could be required to make an immediate lump-sum payment (or “early termination payment”) under the terms of the TRA, which can be significantly impacted by the closing price of our Class A common shares on the applicable termination date or change in control date. We currently do not anticipate experiencing a change of control or an early termination of the TRA.

9.Debt

At December 31, 2024 and 2023, our debt consisted of the following:

(in thousands)


December 31, 

December 31,


2024

2023

7.625% Senior Sustainability-Linked Notes

$

400,000

$

400,000

Credit Facility

44,000

26,000

Total Long-Term Debt

444,000

426,000

Less: Unamortized Debt Issuance Costs

(2,338)

(4,208)

Total Long-Term Debt, Net of Debt Issuance Costs

441,662

421,792

Insurance Premium Financing Liability

6,725

5,463

Total Debt

$

448,387

$

427,255

Senior Sustainability-Linked Notes

In April 2021, we issued $400.0 million aggregate principal amount of 7.625% Senior Sustainability-Linked Notes (the “Notes”) due April 1, 2026. The Notes are unsecured and effectively subordinated to the Credit Facility to the extent of the value of the collateral securing the Credit Facility. The Notes are guaranteed on a senior unsecured basis by our wholly-owned subsidiaries. Interest on the Notes is payable on April 1 and October 1 of each year. We may redeem all or part of the Notes at any time at a redemption price of 101.9063% through March 31, 2025 and a redemption price of 100% on or after April 1, 2025. If we undergo a change of control, we may be required to repurchase all or a portion of the Notes at a price equal to 101% of the principal amount of the Notes, plus accrued interest.

During 2023, we notified the trustee for the Notes that, for the year ended December 31, 2022, we had satisfied the Sustainability Performance Target (as defined in the indenture governing the Notes) in accordance with the requirements and procedures of the indenture. As a result, the interest rate on the Notes will remain 7.625% for the remainder of the term of the Notes.

Credit Facility

Concurrent with the Notes offering in April 2021, we entered into an amended and restated credit agreement (as it may be amended and/or restated from time to time, the “Credit Agreement”) to, among other things, (i) decrease the commitments under the Credit Facility to $200.0 million, (ii) extend the maturity date to April 1, 2025, (iii) reprice the loans made under the Credit Facility and unused commitment fees to be determined based on a leverage ratio ranging from 3.00:1.00 to 4.50:1.00, (iv) include an accordion feature permitting the Company to seek an increase of the Credit Facility of up to $75.0 million, subject to certain conditions, (v) amend the leverage ratio covenant to comprise of a maximum total funded debt to EBITDA ratio, net of $40.0 million of unrestricted cash and cash equivalents if the facility is drawn, and net of all

108

Table of Contents

unrestricted cash and cash equivalents if the facility is undrawn, (vii) increase the leverage ratio covenant test level for the first two fiscal quarters of 2021 to 5.00 to 1.00, for the third quarter of 2021 to 4.75 to 1.00, and thereafter to 4.50 to 1.00 and (viii) add a secured leverage ratio covenant of 2.50 to 1.00.

The Credit Facility provided for, at our option:

(i)Base rate borrowings that bear interest at the highest of (a) the prime rate, (b) the federal funds effective rate plus 0.50% and (c) LIBOR plus 1%; plus a margin that ranges from 175 basis points to 275 basis points, depending upon our leverage ratio; or

(ii)Eurodollar borrowings that bear interest at the lesser of (i) LIBOR plus a margin that ranges from 275 basis points to 375 basis points, depending upon our leverage ratio;

(iii)Plus commitment fee rates that range from 37.5 basis points to 50.0 basis points, depending upon our leverage ratio.

In May 2023, the Credit Agreement was amended to, among other things, transition the loans under the Credit Facility to be made at SOFR instead of LIBOR and to allow financial reporting to be satisfied based on delivery of the consolidated financial statements of Aris Water Solutions, Inc., so long as it remains a passive holding company, instead of Solaris Midstream Holdings, LLC.

In October 2023, the Credit Agreement was amended and restated to provide for, among other things, (i) commitments of $350.0 million, (ii) a maturity date of October 12, 2027, with a springing maturity of 91 days ahead of the Notes’ due date of April 1, 2026 in the event the Notes are not voluntarily redeemed, repurchased, refinanced or otherwise retired in full prior to such springing maturity date, (iii) loans made under the Credit Facility and unused commitment fees to be determined based on a leverage ratio ranging from 3.00:1.00 to 4.50:1.00, (iv) an accordion feature permitting the Company to seek an increase of the Credit Facility of up to $150.0 million, subject to certain conditions, (v) a leverage ratio covenant which comprises a maximum total funded debt to EBITDA ratio, net of $40.0 million of unrestricted cash and cash equivalents if the facility is drawn, and net of all unrestricted cash and cash equivalents if the facility is undrawn, (vi) a leverage ratio covenant test level which is currently 4.50 to 1.00 and (vii) a secured leverage ratio covenant of 2.50 to 1.00.

The Credit Facility provides for, at our option:

i.Base rate borrowings that bear interest at the highest of (a) the prime rate, (b) the federal funds effective rate plus 0.50% and (c) Term SOFR for an interest period of one month plus 1.00%; plus a margin that ranges from 175 basis points to 275 basis points, depending upon our leverage ratio; or
ii.SOFR borrowings that bear interest at Term SOFR plus SOFR Adjustment of 0.10% plus a margin that ranges from 275 basis points to 375 basis points, depending upon our leverage ratio.

We incurred $3.9 million of expenses in 2023 to refinance the Credit Facility that are included in “Other Assets” on the consolidated balance sheet and “Payment of Debt Issuance Costs Related to Credit Facility” on the consolidated statements of cash flows and will be amortized over the remaining loan term. This was accounted for as a debt modification, and we recognized a loss of $0.1 million in the fourth quarter of 2023 which is included in “Other” expense on the consolidated statements of operations and consolidated statements of cash flows.

Our weighted average interest rate on outstanding borrowings under the Credit Facility was 7.408% and 8.276% as of December 31, 2024 and 2023, respectively. As of December 31, 2024, we had $44.0 million of outstanding borrowings under the Credit Facility, $3.3 million in letters of credit outstanding and $302.7 million in revolving commitments available.

109

Table of Contents

The Credit Facility is secured by all of the real and material personal property owned by Solaris LLC or any of its subsidiaries, other than certain excluded assets. As of December 31, 2024, we were in compliance with all covenants contained in the Credit Facility.

Insurance Premium Financing

In the fourth quarter of 2024, we entered into a short-term agreement with a third-party to finance certain insurance premiums for an aggregate amount of $8.8 million, which is secured by all sums payable to the Company with reference to the insurance policies financed pursuant to this agreement, including any gross return premiums and any payment on account of loss which results in reduction of unearned premium in accordance with the term of the agreement. Under the terms and provisions of the agreement, the insurance premium financing is repayable in 11 monthly installments of principal and interest through September 2025, at a weighted-average annual percentage rate of 6.99%. As of December 31, 2024, the remaining balance was $6.7 million and is included in “Insurance Premium Financing Liability” on the consolidated balance sheet.

In the fourth quarter of 2023, we entered into a short-term agreement with a third-party to finance certain insurance premiums for an aggregate amount of $6.6 million, at a weighted-average annual percentage rate of 7.49%. The insurance premium financing had similar terms to the policy described above and was fully repaid as of September 30, 2024.

(in thousands)

Year Ended December 31,


2024

2023

Insurance Premium Financing Liability, Beginning Balance

$

5,463

$

Obligations Added During the Year

8,779

6,636

Obligations Paid During the Year

(7,517)

(1,173)

Insurance Premium Financing Liability, Ending Balance

$

6,725

$

5,463

Debt Maturities

The following table provides the scheduled maturities of debt outstanding at December 31, 2024, for each of the next five years and thereafter. The amounts presented exclude unamortized discounts and debt issuance costs:

(in thousands)


2025

$

6,725

2026

400,000

2027

44,000

Total Debt Payments

$

450,725

10. Leases

In the normal course of business, we enter into lease agreements to support our operations. Our operating lease assets include right-of-way easements for our wells and facilities, office space and other assets. Our finance lease assets include field vehicles.

110

Table of Contents

Balance Sheet Information

The following table shows the classification and location of our right-of-use assets and lease liabilities on our consolidated balance sheet:

(in thousands)

December 31, 

December 31,

2024

2023

Operating Leases

Assets

Operating Lease Right-of-Use Assets, Net

$

15,016

$

16,726

Liabilities

Accrued and Other Current Liabilities

1,568

1,676

Other Long-Term Liabilities

14,040

14,716

Finance Leases

Assets

Property, Plant and Equipment

$

2,902

$

Less: Accumulated Depreciation

(171)

Total Property, Plant and Equipment, Net

2,731

Liabilities

Accrued and Other Current Liabilities

571

Other Long-Term Liabilities

1,747

During the third quarter of 2024, we entered into an agreement to begin leasing a portion of our field vehicles, which are accounted for as finance leases and primarily have an initial term of 48 months. As of December 31, 2024, we had 54 vehicle leases.

The operating lease for our corporate office space in Houston, Texas commenced on September 30, 2023 and expires in September 2033, with options for renewal. On the commencement date, we recorded a right-of-use asset of $7.7 million, a current lease liability of $0.3 million and a noncurrent lease liability of $6.4 million.

Statement of Operations Information

The following table provides the components of lease costs recognized in our consolidated statements of operations for the periods indicated:

(in thousands)

Year Ended December 31, 

2024


2023


2022

Operating Lease Costs

Direct Operating Costs (1)

$

1,388

$

1,253

$

969

General and Administrative (1)

2,067

1,144

700

Finance Lease Costs

Amortization of right-of-use asset (2)

171

Interest on Lease Obligations (3)

40

Total Lease Cost

$

3,666

$

2,397

$

1,669

(1)Does not include short-term lease costs.
(2)Included in “Depreciation, Amortization and Accretion” in our consolidated statements of operations.
(3)Included in “Interest Expense, Net” in our consolidated statements of operations.

111

Table of Contents

Short-term Leases

Our short-term lease costs, consisting primarily of field equipment rentals, totaled $12.9 million, $14.6 million and $11.1 million for the years ended December 31, 2024, 2023 and 2022, respectively.

Cash Flow Information

The following table summarizes supplemental cash flow information related to leases:

(in thousands)

Year Ended December 31, 

2024


2023


2022

Cash Paid for Amounts Included in the Measurement of Lease Liabilities

Operating Cash Flows from Operating Leases

$

2,528

$

1,543

$

1,282

Financing Cash Flows from Finance Leases

553

Right-of-Use Assets Obtained in Exchange for Lease Liabilities, Net

Operating Leases

$

768

$

10,052

$

2,639

Finance Leases

2,902

Lease Terms and Discount Rates

The following table provides lease terms and discount rates related to leases:

December 31, 2024

December 31, 2023

Weighted Average Remaining Lease Term (Years)

Operating Leases

6.9

7.6

Finance Leases

3.7

Weighted Average Discount Rate

Operating Leases

6.42%

6.30%

Finance Leases

7.45%

Annual Lease Maturities

The following table provides maturities of lease liabilities at December 31, 2024:

(in thousands)

Operating Leases

Finance Leases

Total

2025

$

2,230

$

725

$

2,955

2026

1,961

725

2,686

2027

3,302

702

4,004

2028

2,868

508

3,376

2029

2,423

2,423

Thereafter

6,819

6,819

Total Lease Payments

19,603

2,660

22,263

Less: Interest

(3,995)

(342)

(4,337)

Present Value of Lease Liabilities

$

15,608

$

2,318

$

17,926

Subleases

During the fourth quarter of 2023, we entered into two subleases related to our previous office space in Houston, Texas. The first sublease commenced in October 2023 and expires in December 2025, with no option for renewal. The second sublease commenced in November 2023 and expires in October 2028, with no option for renewal. The subtenants are also responsible for certain operating expenses associated with the office building, including utilities, which are considered variable lease payments.

112

Table of Contents

We recognized total sublease income, including variable lease payments, of $0.6 million and $0.1 million for the years ended December 31, 2024 and 2023, respectively, which is recorded as a reduction of rent expense under our head lease and is included in “General and Administrative” expense on the consolidated statements of operations.

The following table provides the sublease income we expect to recognize, excluding variable lease payments and undiscounted, as of December 31, 2024:

(in thousands)

2025

$

388

2026

287

2027

292

2028

248

Total Sublease Income

$

1,215

11.Income Taxes

Income Before Income Taxes

Our income before income taxes is comprised of the following:

(in thousands)

Year Ended December 31, 

2024

2023


2022

Domestic

$

70,519

$

50,906

$

5,321

Foreign

-

-

-

Total

$

70,519

$

50,906

$

5,321

Income Tax Provision

The income tax provision consists of the following:

(in thousands)

Year Ended December 31, 

2024

2023


2022

Current Income Tax Expense

Federal

$

1,265

$

23

$

1

State

387

172

57

Total Current Income Tax Expense

1,652

195

58

Deferred Income Tax Expense

Federal

6,363

5,697

410

State

2,326

1,602

56

Total Deferred Income Tax Expense

8,689

7,299

466

Total Income Tax Expense

$

10,341

$

7,494

$

524

Federal income taxes payable were $0.9 million and $12 thousand as of December 31, 2024 and 2023, respectively. State income taxes payable were $0.3 million and $0.1 million as of December 31, 2024 and 2023, respectively.

113

Table of Contents

Effective Tax Rate (“ETR”)

A reconciliation of the U.S. federal statutory income tax rate to our effective tax rate is comprised of the following:

(in thousands, except percentages)

Year Ended December 31, 

2024

2023

2022

$

%

$

%

$

%

Statutory Rate Applied to Income Before Taxes

$

14,809

21.0

%

$

10,690

21.0

%

$

1,117

21.0

%

Effect of


State Taxes, Net of Federal Benefit

2,188

3.1

%

1,444

2.8

%

113

2.1

%

Noncontrolling Interest

(7,042)

(10.0)

%

(5,155)

(10.1)

%

(617)

(11.6)

%

Return to Provision

(84)

(0.1)

%

190

0.4

%

(259)

(4.9)

%

Other

470

0.7

%

325

0.6

%

170

3.2

%

Total Effective Tax Rate

$

10,341

14.7

%

$

7,494

14.7

%

$

524

9.8

%

The total effective tax rates for the years ended December 31, 2024, 2023 and 2022 were 14.7%, 14.7% and 9.8%, respectively.

For the years ended December 31, 2024, 2023 and 2022, the difference between the U.S. federal statutory tax rate and the total effective tax rate was primarily due to the impact of the noncontrolling interest.

We have an ownership interest in Solaris LLC and its subsidiaries. Solaris LLC is treated as a partnership for U.S. federal tax purposes and in most applicable jurisdictions for state and local income tax purposes. Any taxable income or loss generated by Solaris LLC is passed through and included in the taxable income or loss of its members, including Aris Inc., in accordance with the terms of the Solaris LLC operating agreement. Aris Inc. is a C Corporation and is subject to U.S. federal, state and local income taxes with respect to its allocable share of any taxable income of Solaris LLC.

Deferred Tax Assets and Liabilities

The tax effects of each type of temporary difference and carryforward that give rise to a significant deferred tax asset or liability as of December 31, 2024 and 2023 are as follows:

(in thousands)

December 31, 

2024


2023

Deferred Income Tax Assets


Net Operating Losses

$

74,956

$

81,787

Interest Expense Carryforward and Other

7,171

6,727

Total Deferred Income Tax Assets

82,127


88,514

Valuation Allowance

(608)


(608)

Net Deferred Income Tax Assets

81,519


87,906

Deferred Income Tax Liabilities


Investment in Partnership

(68,070)


(65,272)

Total Deferred Income Tax Liabilities

(68,070)


(65,272)

Net Deferred Income Tax Asset

$

13,449

$

22,634

114

Table of Contents

The net deferred income tax asset at December 31, 2024 is comprised of total deferred income tax assets net of valuation allowance of $81.5 million, related primarily to net operating losses (“NOLs”), offset by a deferred income tax liability of $68.1 million pertaining to investment in partnership.

The net deferred income tax asset at December 31, 2023 is comprised of total deferred income tax assets net of valuation allowance of $87.9 million, related primarily to NOLs, offset by a deferred income tax liability of $65.3 million pertaining to investment in partnership.

At December 31, 2024, we had unused federal NOL carryforwards for federal income tax purposes of approximately $315.9 million, which can be carried forward indefinitely and may be used to offset future taxable income. In addition, at December 31, 2024, we had unused NOL carryforwards for state income tax purposes of approximately $171.9 million, which can be carried forward indefinitely, and $13.0 million, which expire from 2038 through 2040. All deferred tax assets are evaluated using positive and negative evidence as to their future realization.

As of December 31, 2024, we believe that it is more likely than not that the benefit from certain state NOL carryforwards will not be realized. In recognition of this, we have provided a valuation allowance of $0.6 million on the deferred tax assets related to these state NOL carryforwards, as of December 31, 2024. The valuation allowance was also $0.6 million as of December 31, 2023.

Because of the change of ownership provisions of the Tax Reform Act of 1986, use of a portion of our domestic NOL may be limited in future periods. Further, a portion of the state carryforwards may expire before being applied to reduce future income tax liabilities. If there is a change in our assessment of the amount of deferred income tax assets that are realizable, adjustments to the valuation allowance will be made in future periods.

Other

Solaris LLC, is a Delaware limited liability company treated as a partnership for federal income tax purposes and, therefore, is not subject to U.S. federal income tax at an entity level. Instead, taxable income is allocated to members, including Aris Inc., and except for Texas franchise tax, any taxable income of Solaris LLC is reported in the respective tax returns of its members.

Management evaluates uncertain tax positions for recognition and measurement in the consolidated financial statements. To recognize a tax position, we determine whether it is more likely than not that the tax position will be sustained upon examination, including resolution of any related appeals or litigation, based on the technical merits of the position. A tax position that meets the more likely than not threshold is measured to determine the amount of benefit to be recognized in the consolidated financial statements. As of December 31, 2024, we have no significant uncertain tax positions.

Solaris LLC files income tax returns in the U.S. federal jurisdiction and various states. There are currently no federal or state income tax examinations underway for these jurisdictions. Its federal and state returns remain open to examination for tax years 2020 through 2024.

Solaris LLC is subject to a franchise tax imposed by the State of Texas. The franchise tax rate is 1%, calculated on taxable margin. Taxable margin is defined as total revenue less deductions for cost of goods sold or compensation and benefits in which the total calculated taxable margin cannot exceed 70% of total revenue. Total expense related to Texas margin tax was $0.2 million, $0.1 million and $0.1 million for the years ended December 31, 2024, 2023 and 2022, respectively.

115

Table of Contents

12.Stockholders’ Equity

Stockholders’ Equity

Holders of our Class A common stock and our Class B common stock vote together as a single class on all matters presented to our stockholders for their vote or approval, except as otherwise required by applicable law or our amended and restated certificate of incorporation. To the extent we pay any cash dividends on our Class A common stock, under the terms of our organizational documents, Solaris LLC will pay an equivalent cash distribution on the Solaris LLC units, and each share of Class A common stock and each Solaris LLC unit will receive the same cash amount.

Redemptions

During the years ended December 31, 2024, 2023 and 2022, a total of 50,000, 31,954 and 4,140,585 Solaris LLC units, together with an equal number of shares of our Class B common stock, were redeemed for shares of our Class A common stock on a one-for-one basis.

Dividends and Distributions

Our Board of Directors declared a dividend of $0.09 per share for the first quarter of 2024 and a dividend of $0.105 per share for each of the second, third and fourth quarters of 2024 on our Class A common stock. The dividends declared during 2024 totaled $13.1 million. In conjunction with the dividend payments, a distribution of $0.09 per unit was paid to unit holders of Solaris LLC for the first quarter, and a distribution of $0.105 per unit was paid to unit holders of Solaris LLC for each of the second, third and fourth quarters of 2024. The distributions during 2024 totaled $11.8 million. The total declared dividends and distributions during 2024 was $24.9 million, and the total dividends and distributions paid during 2024 was $24.6 million. The difference between declarations and cash payments during the year ended December 31, 2024 related to dividends for performance-based restricted stock units that are accrued for over the vesting period and will be paid upon payment of the underlying award.

For each quarter of the year ended December 31, 2023, our Board of Directors declared a dividend of $0.09 per share on our Class A common stock. The dividends declared during 2023 totaled $11.3 million. In conjunction with the dividend payments, distributions of $0.09 per unit were paid to unit holders of Solaris LLC during each quarter. The distributions during 2023 totaled $10.3 million. The total declared dividends and distributions during 2023 was $21.6 million, and the total dividends and distributions paid during 2023 was $21.4 million. The difference between declarations and cash payments during the year ended December 31, 2023 related to dividends accrued for unvested performance-based restricted stock units.

For each quarter of the year ended December 31, 2022, our Board of Directors declared a dividend of $0.09 per share on our Class A common stock. The dividends during 2022 totaled $9.0 million. In conjunction with the dividend payments, distributions of $0.09 per unit were paid to unit holders of Solaris LLC during each quarter. The distributions during 2022 totaled $11.7 million. The total declared dividends and distributions during 2022 was $20.7 million, and the total dividends and distributions paid during 2022 was $24.5 million. The difference between declarations and cash payments during the year ended December 31, 2022 primarily related to dividends declared in 2021 which were paid in 2022, partially offset by dividends accrued for unvested performance-based restricted stock units.

On February 26, 2025, our Board of Directors declared a dividend on our Class A common stock for the first quarter of 2025 of $0.14 per share. In conjunction with the dividend payment, a distribution of $0.14 per unit will be paid to unit holders of Solaris LLC. The dividend will be paid on March 27, 2025 to holders of record of our Class A common stock as of the close of business on March 13, 2025. The distribution to unit holders of Solaris LLC will be subject to the same payment and record dates.

116

Table of Contents

Treasury Stock

During the years ended December 31, 2024, 2023 and 2022, 217,516 shares, 136,086 shares and 186,571 shares, respectively, of our Class A common stock were withheld for the payment of taxes due on shares of common stock issued to employees under our 2021 Equity Incentive Plan.

In connection with the assets acquired from Delaware Energy, as discussed above, certain shares of our Class A common stock issued to the seller were held in escrow and could be released to us under certain conditions, including for the reimbursement of certain post-acquisition workover costs pursuant to the terms of the asset purchase agreement. During the first quarter of 2024, 23,107 of these escrow shares were released and returned to the Company for reimbursement of such workover costs and are included in “Treasury Stock” at a value of $0.3 million, which was their fair market value at the date of receipt. The receipt of these shares was recorded as a non-cash treasury stock transaction, with an allocation of the difference between the contractually ascribed value of the shares per the asset purchase agreement and the cost of the shares at the date of receipt recorded against the workover costs in the amount of $0.1 million. During the second half of 2023, 85,471 of these escrow shares were released and returned to the Company for reimbursement of such workover costs and are included in “Treasury Stock” at a value of $0.9 million, which was their fair market value at the date of receipt. The receipt of these shares was recorded as a non-cash treasury stock transaction, with an allocation of the difference between the contractually ascribed value of the shares per the asset purchase agreement and the cost of the shares at the date of receipt recorded against the workover costs in the amount of $0.7 million. As of March 31, 2024, there were no remaining shares left in escrow.

Partnership Distributions

Under the Solaris LLC Agreement, Solaris LLC shall make pro rata advanced distributions to Aris Inc. to enable Aris Inc. to timely satisfy its tax liabilities. If an advance is made to Aris Inc. to enable it to pay certain applicable taxes, Solaris LLC will use commercially reasonable efforts to make any such distribution to all members on a pro rata basis. As of December 31, 2024, the Company accrued a tax-related partnership distribution liability of $1.3 million, which is included in “Accrued and Other Current Liabilities” on the consolidated balance sheet. The partnership distributions are recorded as a reduction of non-controlling interests on the consolidated balance sheet.

13.Commitments and Contingencies

In the normal course of business, we are subject to various claims, legal actions, contract negotiations and disputes. We provide for losses, if any, in the period in which they become probable and can be reasonably estimated. In management’s opinion, there are currently no such matters outstanding that would have a material effect on the accompanying consolidated financial statements.

Additionally, we are party to a guarantee related to a lease agreement with Solaris Energy Management, LLC (“SEM”), a related party of the Company, for the rental of office space at our previous corporate headquarters. As of December 31, 2024, our share of SEM’s future commitment is included in our lease liabilities. See Note 10. Leases and Note 16. Related Party Transactions.

Delivery Commitment

In the first quarter of 2023, we entered into an agreement with an unaffiliated water disposal company to dispose a minimum volume of produced water over a term of seven years, for a total financial commitment of approximately $28.0 million, undiscounted, and not including annual CPI adjustments. The agreement requires us to make payments for any shortfall in delivering an annual minimum volume under the commitment as well as a cumulative minimum volume over the duration of the term of the commitment. The minimum volume commitment is contingent on several performance factors to be achieved by the unaffiliated water disposal company throughout the term of the contract, which, if not achieved, would provide us with the option of cancelling the contract and discharging the remaining minimum volume commitment. We began

117

Table of Contents

delivering produced water under this agreement in June 2023. As of December 31, 2024, the remaining minimum commitment was $22.4 million, undiscounted, which includes a minimum annual commitment of $4.1 million for each of the years 2025 through 2029 and $1.8 million thereafter, based on the current contract rate and not considering rate increases.

Other Commitments

In the normal course of business, we enter into short-term purchase obligations for products and services, primarily related to purchases of pipe, pumps and other components. As of December 31, 2024, we had purchase obligations and commitments of approximately $5.1 million due in the next twelve months.

We are a party to various surface use and compensation agreements by which we have committed to make minimum royalty payments in exchange for rights to access and use the land for purposes that are generally limited to conducting our water operations. These agreements do not meet the definition of a lease under ASC Topic 842.

We are party to a fixed price power purchase contract to manage the volatility of the price of power needed for ongoing operations. We have elected the normal purchase and normal sale accounting treatment for this contract and therefore record it at cost. In May 2024, we extended the fixed price power purchase contact through April 2028.

The table below provides estimates of the timing of future payments that we are contractually obligated to make based on agreements in place as of December 31, 2024:

(in thousands)


2025


2026


2027


2028


2029


Total

Purchase Obligations and Commitments

$

5,089

$

-

$

-

$

-

$

-

$

5,089

Surface Use and Compensation Agreements

3,714

11,300

1,350

1,400

1,700

19,464

Fixed Price Power Purchase Contract

5,805

7,853

7,861

3,147

-

24,666

Total

$

14,608

19,153

$

9,211

$

4,547

$

1,700

$

49,219

Environmental

We are also subject to various federal, state and local laws and regulations relating to the protection of the environment. For the years ended December 31, 2024, 2023 and 2022, we recognized $2.5 million, $4.6 million and $3.0 million of expenses, respectively, related to environmental matters that are recorded in “Direct Operating Costs” in the consolidated statements of operations. As of December 31, 2024, we accrued insurance proceeds and third-party receivables of $6.0 million, of which $5.1 million are included in “Other Receivables” and $0.9 million are included in “Other Assets.” As of December 31, 2023, we accrued insurance proceeds and third-party receivables of $5.7 million, of which $4.1 million are included in “Other Receivables” and $1.6 million are included in “Other Assets.” We believe these proceeds are probable to collect and are reasonably estimable. Although we believe these estimates are reasonable, actual results could differ from these estimates.

14.Earnings Per Share

Net Income Per Share

Basic and diluted net income per share attributable to our Class A common stock is computed by dividing net income attributable to Aris Inc. by the weighted average number of shares of Class A common stock outstanding for the same period, including RSUs, which receive nonforfeitable dividends. Shares issued during the period are weighted for the portion of the period in which the shares were outstanding.

118

Table of Contents

The following table sets forth the computation of basic and diluted net income per share attributable to our Class A common stock for the periods indicated:

Year Ended

Year Ended

Year Ended

(in thousands, except for share and per share amounts)

December 31, 2024

December 31, 2023

December 31, 2022

Net Income Attributable to Stockholders' Equity

$

60,178

$

43,412

$

4,797

Less: Net Income Attributable to Noncontrolling Interest

(33,321)

(24,524)

(3,097)

Net Income Attributable to Aris Water Solutions, Inc.

26,857

18,888

1,700

Participating Basic Earnings (1)

(1,982)

(1,144)

(686)

Basic Net Income Attributable to Aris Water Solutions, Inc.

$

24,875

$

17,744

$

1,014

Reallocation of Participating Net Income

9

-

-

Diluted Net Income Attributable to Aris Water Solutions, Inc.

$

24,884

$

17,744

$

1,014

Basic Weighted Average Shares Outstanding

30,575,739

30,037,681

24,070,934

Dilutive Performance-Based Stock Units

301,898

-

75,281

Dilutive Weighted Average Shares Outstanding

30,877,637

30,037,681

24,146,215

Basic Net Income Per Share of Class A Common Stock

$

0.81

$

0.59

$

0.04

Diluted Net Income Per Share of Class A Common Stock

$

0.81

$

0.59

$

0.04

(1)Unvested shares of restricted stock and RSUs represent participating securities because they participate in nonforfeitable dividends or distributions with the common equity holders of the Company. Participating basic earnings represent the distributed and undistributed earnings of the Company attributable to participating securities. Unvested RSUs and vested but not issued RSUs do not participate in undistributed net losses as they are not contractually obligated to do so.

Shares of Class B common stock are considered potentially dilutive shares of Class A common stock because they may be redeemed for shares of Class A common stock on a one-for-one basis. A total of 27,539,489 shares of Class B common stock and 5,763 PSUs outstanding were determined to be antidilutive and were excluded from the computation of diluted earnings per share of Class A common stock for the year ended December 31, 2024.

A total of 27,554,221 shares of Class B common stock and 27,308 PSUs outstanding were determined to be antidilutive and were excluded from the computation of diluted earnings per share of Class A common stock for the year ended December 31, 2023.

A total of 30,929,045 shares of Class B common stock and 4,771 PSUs outstanding were determined to be antidilutive and were excluded from the computation of diluted earnings per share of Class A common stock for the year ended December 31, 2022.

15.Stock-Based Compensation and Other Compensation Plans

2021 Equity Incentive Plan

In connection with the IPO, our Board of Directors adopted the 2021 Equity Incentive Plan. The 2021 Equity Incentive Plan allows for the grant of stock options, both incentive stock options and “non-qualified” stock options; stock appreciation rights, alone or in conjunction with other awards; restricted stock and restricted stock units (“RSUs”); incentive bonuses, which may be paid in cash, stock or a combination thereof; and other stock-based awards. We refer to these collectively herein as “Awards”.

The 2021 Equity Incentive Plan is administered by our compensation committee, or such other committee designated by our Board of Directors to administer the plan.

In May of 2024, an additional 5,750,000 shares were approved under the 2021 Equity Incentive Plan. The maximum number of shares of Class A common stock that may be issued under the 2021 Equity Incentive Plan will not exceed 11,100,000 shares, subject to certain adjustments in the event of a change in our capitalization.

119

Table of Contents

Restricted Stock Units

RSU activity during the period was as follows:


RSUs


Weighted-Average Grant Date Fair Value

Outstanding at December 31, 2023

1,606,303

$

11.72

Granted

1,517,153

12.29

Forfeited

(90,911)

12.00

Vested (1)

(856,614)

12.13

Outstanding at December 31, 2024

2,175,931

$

11.94

(1)Includes 60,078 of awards that vested but have not yet been issued. For these awards, the requisite service period was met during the three months ended September 30, 2024, and the awardees elected to defer issuance until retirement. Compensation expense for these shares was previously recognized over the requisite service period.

The RSUs granted generally vest in the following installments: (i) one-third at the first anniversary of the award date, (ii) one-third at the second anniversary of the award date and (iii) one-third at the third anniversary of the award date. The grant date fair value of the awards was determined using the Company’s closing stock price on the last business day prior to the date of grant. Unvested RSUs and vested but not issued RSUs participate in nonforfeitable dividends or distributions with the common equity holders of the Company.

The total fair value of RSUs that vested during the years ended December 31, 2024, 2023 and 2022 was $10.4 million, $7.6 million and $9.8 million, respectively.

The weighted average grant date fair value of RSUs granted during 2023 and 2022 was $10.26 per share and $15.06 per share, respectively. 

As of December 31, 2024, $16.4 million of compensation cost related to our unvested RSUs remained to be recognized over a weighted-average period of 0.9 years. Common stock dividends are paid on unvested shares of restricted stock and RSUs and vested but not issued RSUs. We issue new shares of our common stock when awarding restricted stock and RSUs.

Performance-Based Restricted Stock Units

PSU activity during the period was as follows:


PSUs


Weighted-Average Grant Date Fair Value

Outstanding at December 31, 2023

404,993

$

13.06

Granted

281,527

29.38

Forfeited

(9,957)

14.23

Vested (1)

(107,225)

25.36

Outstanding at December 31, 2024

569,338

$

18.79

(1)On December 31, 2024, the performance period ended for these PSUs. Each PSU was converted into 1.57 shares representing 168,742 shares of Class A common stock that were issued in February 2025.

120

Table of Contents

The PSUs granted in 2024 were granted to management under the 2021 Equity Incentive Plan and have the following performance criteria:

Relative PSUs: 50% of the PSUs are based on total shareholder return relative to the total shareholder return of a predetermined group of peer companies. This relative total shareholder return is calculated at the end of the performance periods stipulated in the PSU agreement.
Absolute PSUs: 50% of the PSUs have a performance criteria of absolute total shareholder return calculated at the end of the performance period stipulated in the PSU agreement.

The vesting and payout of the PSUs occur when the related service condition is completed, which is approximately three years after the grant date regardless of the duration of the stipulated performance period. The PSUs can be paid out in either Class A common stock or cash, at our election. Dividends accrue on PSUs and are paid upon vesting. As of December 31, 2024, $7.1 million of compensation cost related to unvested PSUs remained to be recognized over a weighted-average period of 1.3 years.

The grant date fair value was determined using the Monte Carlo simulation method and is expensed ratably over the service period. Expected volatilities used in the fair value simulation were estimated using historical periods consistent with the remaining performance periods. The risk-free rate was based on the U.S. Treasury rate for a term commensurate with the expected life of the grant.

We used the following assumptions to estimate the fair value of PSUs granted during the periods indicated:

Year Ended December 31, 


2024

2023


2022

Risk-free Interest Rate

4.67%

4.32%

1.44%

Volatility Range

17.04% - 61.19%

24.31% - 78.49%

35.95% - 154.23%

During the years ended December 31, 2023 and 2022, we granted 358,551 PSUs and 167,228 PSUs, respectively, with a weighted average grant date fair value of $8.44 and $25.36, respectively, to management under the 2021 Equity Incentive Plan.

Compensation Cost

For the years ended December 31, 2024, 2023 and 2022, we recognized total stock-based compensation expense of $18.2 million, $11.6 million and $12.0 million, respectively, of which $17.0 million, $10.8 million and $11.4 million, respectively, was included in general and administrative expenses and $1.2 million, $0.8 million and $0.6 million, respectively, was included in direct operating costs. The related tax benefit was $2.7 million, $1.2 million and $1.3 million for the years ended December 31, 2024, 2023 and 2022, respectively.

401(k) Plan

We sponsor a Safe Harbor 401(k) Plan with a Company match of up to 6% of the employee’s salary. We made contributions of $1.3 million, $0.7 million and $0.6 million for the years ended December 31, 2024, 2023 and 2022, respectively. The Company match was increased to up to 6% of the employee’s salary, effective January 1, 2024. The Company match was up to 4% of the employee’s salary for the years ended December 31, 2023 and 2022.

16.Related Party Transactions

Solaris Energy Management, LLC

We have an administrative services arrangement with SEM, a company owned by William A. Zartler, our Founder and Executive Chairman, for the provision of administrative services at cost. In addition, SEM

121

Table of Contents

provides office space and services for equipment and supplies to us under the administrative services agreement.

For the years ended December 31, 2024, 2023 and 2022, we incurred $0.1 million, $0.7 million and $0.6 million, respectively, of expense for these services, which is included in “General and Administrative” expenses on the consolidated statements of operations.

We had no accrued payables to SEM as of December 31, 2024 and 2023. As of December 31, 2024 and 2023, we had prepaid balances to SEM of $0.2 million to cover future rent and other expenses.

Solaris Energy Capital, LLC

There are certain de minimis general and administrative expenses that are paid on our behalf by Solaris Energy Capital, LLC, a company owned by William A. Zartler, and are recorded in “General and Administrative” expenses. We had no accrued payables to Solaris Energy Capital, LLC as of December 31, 2024 and 2023.

Solaris Energy Infrastructure, Inc.

There are general and administrative expenses that are paid on our behalf by Solaris Energy Infrastructure, Inc, previously “Solaris Oilfield Infrastructure, Inc.”, a company owned by William A. Zartler, and are recorded in “General and Administrative” expenses on the consolidated statements of operations. For the year ended December 31, 2024, we incurred $0.2 million of expense for these services, and the expense for the years ended December 31, 2023 and 2022 was de minimis.

We had $0.1 million of accrued payables to Solaris Energy Infrastructure, Inc. as of December 31, 2024 and no accrued payables as of December 31, 2023

Blanco Aviation, LLC

We are a party to an aircraft “dry” lease arrangement with Blanco Air Services, LLC, a company owned by William A. Zartler, for the use of certain aircrafts billed at an hourly rate. We incurred expense of approximately $0.1 million for each of the years ended December 31, 2024, 2023 and 2022, which is recorded in “General and Administrative” expenses. We had a de minimis accrued payables balance to Blanco Aviation, LLC as of December 31, 2024 and no accrued payables as of 2023.

Vision Resources, Inc.

We purchase brackish water for use in our Water Solutions activities from Vision Resources, Inc (“Vision”). Vision is a Legacy Owner of Solaris LLC. For the years ended December 31, 2024, 2023 and 2022, we made purchases of $1.2 million, $2.0 million and $1.4 million, respectively, for water and services. Accrued payables to Vision as of December 31, 2024 and 2023 were $0.2 million and $0.1 million, respectively.

We also rent office space from an affiliate of Vision in Carlsbad, New Mexico and have incurred rent expense of $0.2 million for each of the years ended December 31, 2024, 2023 and 2022.

ConocoPhillips

We and ConocoPhillips, one of our principal owners, have a long-term water gathering and handling agreement, pursuant to which ConocoPhillips dedicates all the produced water generated from its current and future acreage in a defined area of mutual interest in New Mexico and Texas. As of December 31, 2024 and 2023, we had a receivable of $12.0 million and $23.0 million, respectively, from ConocoPhillips that was recorded in “Accounts Receivable from Affiliate” on the consolidated balance sheet. As of December 31, 2024 and 2023, we had a payable of $0.7 million and $0.9 million, respectively, to ConocoPhillips that was

122

Table of Contents

recorded in “Payables to Affiliate” on the consolidated balance sheet. The following table shows revenue and expenses from ConocoPhillips:

(in thousands)

Year Ended December 31, 


2024


2023


2022

Revenue from ConocoPhillips

$

137,320

$

127,933

$

108,263

Operating Expenses Reimbursed to ConocoPhillips

$

776

$

(1,223)

$

1,447

Operating expenses reimbursed to ConocoPhillips are related to ConocoPhillips’ costs for operating certain assets on our behalf between closing and the transfer of the acquired assets and other ongoing operating expenses.

Item 9. Changes in and Disagreements With Accountants on Accounting and Financial Disclosure

None.

Item 9A. Controls and Procedures

Evaluation of Disclosure Controls and Procedures

We maintain disclosure controls and procedures that are designed to ensure that information required to be disclosed by us in the reports that we file or submit under the Exchange Act is recorded, processed, summarized and reported within the time periods specified in SEC’s rules and forms and that such information is accumulated and communicated to our management, including our principal executive officer and principal financial officer, as appropriate, to allow timely decisions regarding required disclosure. Any controls and procedures, no matter how well designed and operated, can provide only reasonable assurance of achieving the desired control objectives.

In accordance with Exchange Act Rules 13a-15 and 15d-15, our management, with the participation of our principal executive officer and principal financial officer, evaluated as of the end of the period covered by this Annual Report on Form 10-K, the effectiveness of our disclosure controls and procedures (as defined in Rules 13a-15(e) and 15d-15(e) under the Exchange Act). Based on that evaluation, our principal executive officer and principal financial officer have concluded that, as of December 31, 2024, our disclosure controls and procedures were effective at the reasonable assurance level.

Management’s Annual Report on Internal Control over Financial Reporting

Our management is responsible for establishing and maintaining adequate internal control over financial reporting (as such term is defined in Exchange Act Rules 13a-15(f) and 15d-15(f)). The Company’s internal control over financial reporting is designed to provide reasonable assurance regarding the reliability of financial reporting and the preparation of the Company’s financial statements for external purposes in accordance with accounting principles generally accepted in the United States of America.

Because of its inherent limitations, internal control over financial reporting may not prevent or detect misstatements in a timely manner. Also, projections of any evaluation of effectiveness to future periods are subject to the risk that controls may become inadequate because of changes in conditions or that the degree of compliance with the policies or procedures may deteriorate.

As of December 31, 2024, management assessed the effectiveness of the Company’s internal control over financial reporting based on the criteria established in “Internal Control - Integrated Framework (2013)” issued by the Committee of Sponsoring Organizations of the Treadway Commission. Based on this assessment, management determined that the Company maintained effective internal control over financial reporting as of December 31, 2024.

123

Table of Contents

Attestation Report of Independent Registered Public Accounting Firm

This Annual Report does not include an attestation report of our independent registered public accounting firm regarding internal control over financial reporting. Pursuant to the SEC rules, we are not required to have, or to engage our independent audit firm to perform, an audit of the effectiveness of our internal controls over financial reporting for as long as we are an “emerging growth company” pursuant to the provisions of the JOBS Act.

Changes in Internal Control over Financial Reporting

Except as described below, there have been no changes in our internal control over financial reporting (as defined in Rule 13a-15(f) under the Exchange Act) that occurred during our last fiscal quarter that have materially affected, or are reasonably likely to materially affect, our internal control over financial reporting.

During the third quarter of 2024, we implemented a new Enterprise Resource Planning (“ERP”) system. In connection with this ERP system implementation, we updated our internal controls over financial reporting, as necessary, to accommodate modifications to our business processes and accounting procedures. We continue to monitor the impact of this implementation on our processes and procedures, as well as the impact on our internal controls over financial reporting. We do not believe that this ERP system implementation will have an adverse effect on our internal control over financial reporting

Item 9B. Other Information

During the quarter ended December 31, 2024, none of our directors or officers (as defined in Rule 16a-1(f) of the Exchange Act) adopted or terminated a “Rule 10b5-1 trading arrangement” or “non-Rule 10b5-1 trading arrangement,” as each term is defined in Item 408 of Regulation S-K.

Item 9C. Disclosure Regarding Foreign Jurisdictions that Prevent Inspections

Not applicable.

124

Table of Contents

PART III. OTHER INFORMATION

Item 10. Directors, Executive Officers and Corporate Governance.

The information required by this item is incorporated herein by reference to the sections titled “Corporate Governance” and “Executive Officers” of the Company’s 2025 Proxy Statement, which will be filed with the SEC not later than 120 days subsequent to December 31, 2024.

We have adopted a Code of Ethics that applies to all of our directors, officers and employees, including our principal executive, principal financial and principal accounting officers, or persons performing similar functions. Our Code of Ethics is posted on our website located at https://ir.ariswater.com/corporate-governance/governance-documents. We intend to disclose any amendments to, or waivers from, certain provisions of the Code of Ethics that are required to be disclosed under the rules of the Securities and Exchange Commission, and any waivers of the Code of Ethics granted to executive officers and directors that are required to be disclosed by the NYSE, by posting such information on our website within four business days following the date of the amendment or waiver.

Item 11. Executive Compensation

The information required by this item is incorporated herein by reference to the section titled “Executive Compensation” of the Company’s 2025 Proxy Statement, which will be filed with the SEC not later than 120 days subsequent to December 31, 2024.

Item 12. Security Ownership of Certain Beneficial Owners and Management and Related Stockholder Matters.

The information required by this item is incorporated herein by reference to the sections titled “Beneficial Ownership of Securities” and “Securities Authorized for Issuance Under Equity Compensation Plans” of the Company’s 2025 Proxy Statement, which will be filed with the SEC not later than 120 days subsequent to December 31, 2024.

Item 13. Certain Relationships and Related Transactions, and Director Independence

The information required by this item is incorporated herein by reference to the sections titled “Corporate Governance – Director Independence” and “Certain Relationships and Related Party Transactions” to the Company’s 2025 Proxy Statement, which will be filed with the SEC not later than 120 days subsequent to December 31, 2024.

Item 14. Principal Accountant Fees and Services

The information required by this item is incorporated herein by reference to the section titled “Proposal [Two] – Ratification of Appointment of Independent Registered Public Accounting Firm” to the Company’s 2025 Proxy Statement, which will be filed with the SEC not later than 120 days subsequent to December 31, 2024.

Part IV

Item 15. Exhibits, Financial Statement Schedules

(a)The following documents are filed as a part of this report:

125

Table of Contents

(1)Financial Statements: The consolidated financial statements and related notes, together with the report of BDO USA, P.C., Independent Registered Public Accounting Firm, appear in Part II, Item 8. Financial Statements and Supplementary Data, of this Form 10-K.
(2)Financial Statement Schedules: All schedules for which provision is made in the applicable accounting regulations of the SEC are not required under the related instruction or are inapplicable and, therefore, have been omitted.
(3)Exhibits: The exhibits listed below on the Index to Exhibits are filed or incorporated by reference as part of this Form 10-K.

126

Table of Contents

Item 16. Form 10–K Summary

None.

INDEX TO EXHIBITS

Exhibit


Description

3.1

Second Amended and Restated Certificate of Incorporation of Aris Water Solutions, Inc. (incorporated by reference to Exhibit 3.2 to the Company’s Current Report on Form 8 K filed on June 9, 2023, File No. 001-40955).

3.2

Amended and Restated Bylaws of Aris Water Solutions, Inc. (incorporated by reference to Exhibit 4.2 to the Company’s Registration Statement on Form S-8 filed on October 26, 2021, File No. 333-260499).

4.1

Description of Securities of the Registrant (incorporated by reference to Exhibit 4.1 to the Company’s Annual Report on Form 10-K filed on February 29, 2024).

4.2

Registration Rights Agreement, dated October 26, 2021, by and among Aris Water Solutions, Inc., Solaris Midstream Holdings, LLC and the other parties thereto (incorporated by reference to Exhibit 4.1 to the Company’s Current Report on Form 8-K filed on October 27, 2021, File No. 333-260499).

4.3

Amendment No. 1 to Registration Rights Agreement, dated March 18, 2022, by and among Aris Water Solutions, Inc., Solaris Midstream Holdings, LLC and the other parties thereto (incorporated by reference to Exhibit 4.1 to the Company’s Quarterly Report on Form 10-Q filed on May 10, 2022).

4.4

Indenture, dated as of April 1, 2021, among Solaris Midstream Holdings, LLC, the guarantors party thereto and Wells Fargo Bank, National Association, as trustee (incorporated by reference to Exhibit 4.1 to the Company’s Registration Statement on Form S-1 filed on September 23, 2021, File No. 333-259740).

10.1

Fourth Amended and Restated Limited Liability Company Agreement of Solaris Midstream Holdings, LLC (incorporated by reference to Exhibit 10.1 to the Company’s Current Report on Form 8-K filed on October 27, 2021, File No. 333-260499).

10.2

Director Nomination Agreement, dated October 26, 2021, by and among Aris Water Solutions, Inc., COG Operating LLC and Yorktown Energy Partners XI, L.P (incorporated by reference to Exhibit 10.12 to the Company’s Current Report on Form 8-K filed on October 27, 2021, File No. 333-260499).

10.3

Tax Receivable Agreement, dated October 26, 2021, by and among Aris Water Solutions, Inc. and the other parties thereto (incorporated by reference to Exhibit 10.13 to the Company’s Current Report on Form 8-K filed on October 27, 2021, File No. 333-260499).

10.4

Third Amended and Restated Credit Agreement, dated as of October 12, 2023, among Solaris Midstream Holdings, LLC, the lenders party thereto, Wells Fargo Bank, National Association, as administrative agent and collateral agent (incorporated by reference to Exhibit 10.1 to the Company’s Current Report on Form 8 K filed on October 12, 2023, File No. 001-40955).

10.5#

Amended and Restated Water Gathering and Disposal Agreement, dated June 11, 2020, by and among Solaris Midstream DB-NM, LLC, COG Operating LLC, COG Production LLC, Concho Oil

127

Table of Contents

Exhibit


Description

& Gas LLC and COG Acreage LP (incorporated by reference to Exhibit 10.8 to the Company’s Registration Statement on Form S-1/A filed on October 7, 2021, File No. 333-260499).

10.6

Amendment No. 1 to Amended and Restated Water Gathering and Disposal Agreement, dated February 15, 2024, by and among Solaris Midstream DB-NM, LLC, COG Operating LLC, COG Production LLC, Concho Oil & Gas LLC and COG Acreage LP (incorporated by reference to Exhibit 10.1 of to the Company’s Quarterly Report on Form 10-Q filed on May 8, 2024).

10.7†

Aris Water Solutions, Inc. 2021 Equity Incentive Plan (incorporated by reference to Exhibit 99.1 to the Company’s Registration Statement on Form S-8 filed on October 26, 2021, File No. 333-260499).

10.8†

Amendment to the Aris Water Solutions, Inc. 2021 Equity Incentive Plan (incorporated by reference to Exhibit 10.1 of to the Company’s Quarterly Report on Form 10-Q filed on November 5, 2024).

10.9†

Amendment to the Aris Water Solutions, Inc. Change in Control Severance Plan (incorporated by reference to Exhibit 10.2 of to the Company’s Quarterly Report on Form 10-Q filed on November 5, 2024).

10.10†*

Amendment to the Aris Water Solutions, Inc. 2021 Equity Incentive Plan.

10.11†

Letter Agreement between Solaris Midstream Holdings, LLC and William Zartler dated January 29, 2021 (incorporated by reference to Exhibit 10.6 to the Company’s Registration Statement on Form S-1/A filed on October 7, 2021, File No. 333-260499).

10.12†

Letter Agreement between Solaris Midstream Holdings, LLC and Amanda Brock dated January 29, 2021 (incorporated by reference to Exhibit 10.7 to the Company’s Registration Statement on Form S-1/A filed on October 7, 2021, File No. 333-260499).

10.13†

Form of Restricted Stock Unit Award Agreement (incorporated by reference to Exhibit 10.19 to the Company’s Annual Report on Form 10-K filed on March 1, 2022).

10.14†

Form of Director Restricted Stock Award Agreement (incorporated by reference to Exhibit 10.1 to the Company’s Quarterly Report on Form 10-Q filed on May 10, 2022).

10.15†

Form of Performance Unit Award Agreement (incorporated by reference to Exhibit 10.2 to the Company’s Quarterly Report on Form 10-Q filed on May 10, 2022).

10.16†

Aris Water Solutions, Inc. Executive Change in Control Severance Plan (incorporated by reference to Exhibit 10.1 of to the Company’s Current Report on Form 8-K filed on June 13, 2022, File No. 001-40955).

10.17†

Form of Indemnification Agreement between Aris Water Solutions, Inc. and each of the officers and directors thereof (incorporated by reference to Exhibit 10.13 to the Company’s Annual Report on Form 10-K filed on March 9, 2023).

10.18†

Aris Water Solutions, Inc. Executive Severance Plan (incorporated by reference to Exhibit 10.1 to the Company’s Current Report on Form 8-K filed on May 16, 2023, File No. 001-40955).

10.19†

Form of Director Restricted Stock Unit Award Agreement (incorporated by reference to Exhibit 10.2 to the Company’s Quarterly Report on Form 10-Q filed on August 3, 2023).

128

Table of Contents

Exhibit


Description

19.1*

Aris Water Solutions, Inc. Insider Trading Policy.

21.1*

List of Subsidiaries of the Registrant.

23.1*

Consent of Independent Registered Public Accounting Firm ─ BDO USA, P.C.

31.1*

Certification of Chief Executive Officer pursuant to Rule 13a-14(a) or 15d-14(a) of the Securities Exchange Act of 1934, as adopted pursuant to Section 302 of the Sarbanes-Oxley Act of 2002.

31.2*

Certification of Chief Financial Officer pursuant to Rule 13a-14(a) or 15d-14(a) of the Securities Exchange Act of 1934, as adopted pursuant to Section 302 of the Sarbanes-Oxley Act of 2002.

32.1**

Certification of Chief Executive Officer pursuant to 18 U.S.C. Section 1350, as adopted pursuant to Section 906 of the Sarbanes-Oxley Act of 2002.

32.2**

Certification of Chief Financial Officer pursuant to 18 U.S.C. Section 1350, as adopted pursuant to Section 906 of the Sarbanes-Oxley Act of 2002.

97.1

Aris Water Solutions, Inc. Compensation Recoupment (Clawback) Policy (incorporated by reference to Exhibit 97.1 to the Company’s Annual Report on Form 10-K filed on February 29, 2024).

101.INS*

XBRL Instance Document - the instance document does not appear in the Interactive Data File because its XBRL tags are embedded within the Inline XBRL document.

101.SCH*

Inline XBRL Schema Document.

101.CAL*

Inline XBRL Calculation Linkbase Document.

101.DEF*

Inline XBRL Definition Linkbase Document.

101.LAB*

Inline XBRL Label Linkbase Document.

101.PRE*

Inline XBRL Presentation Linkbase Document.

104*

Cover Page Interactive Data File (formatted as Inline XBRL and contained in Exhibit 101)

*

Filed herewith.

**Furnished herewith and not deemed to be “filed” for purposes of Section 18 of the Securities Exchange Act of 1934, as amended, and shall not be deemed to be incorporated by reference into any filing under the Securities Act of 1933, as amended, or the Securities Exchange Act of 1934, as amended.

Management contract or compensatory plan or arrangement.

# Certain confidential information contained in this agreement has been omitted because it is both (i) not material and (ii) the type of information that the Company treats as private or confidential.

129

Table of Contents

Signatures

Pursuant to the requirements of Section 13 or 15(d) of the Securities Exchange Act of 1934, the Registrant has duly caused this report to be signed on its behalf by the undersigned, thereunto duly authorized.

February 27, 2025

Aris Water Solutions, Inc.

By: 

/s/ Amanda M. Brock

Amanda M. Brock

President and Chief Executive Officer

/s/ Stephan E. Tompsett

Stephan E. Tompsett

Chief Financial Officer

/s/ Jeffrey K. Hunt

Jeffrey K. Hunt

Chief Accounting Officer

130

Table of Contents

Pursuant to the requirements of the Securities Exchange Act of 1934, this report has been signed below by the following persons on behalf of the registrant and in the capacities and on the dates indicated.

Date

Signature

February 27, 2025

/s/ Amanda M. Brock

Amanda M. Brock

President, Chief Executive Officer, and Director

(principal executive officer)

February 27, 2025

/s/ Stephan E. Tompsett

Stephan E. Tompsett

Chief Financial Officer

(principal financial officer)

February 27, 2025

/s/ Jeffrey K. Hunt

Jeffrey K. Hunt

Chief Accounting Officer

(principal accounting officer)

February 27, 2025

/s/ William A. Zartler

William A. Zartler

Chairman of the Board

February 27, 2025

/s/ Joseph Colonnetta

Joseph Colonnetta

Director

February 27, 2025

/s/ Debra G. Coy

Debra G. Coy

Director

February 27, 2025

/s/ Jacinto J. Hernandez

Jacinto J. Hernandez

Director

February 27, 2025

/s/ W. Howard Keenan, Jr.

W. Howard Keenan, Jr.

Director

February 27, 2025

/s/ Andrew O’Brien

Andrew O’Brien

Director

February 27, 2025

/s/ Donald C. Templin

Donald C. Templin

Director

February 27, 2025

/s/ M. Max Yzaguirre

M. Max Yzaguirre

Director

131